Facilitator guide
Case objectives, demonstration plans, debriefs, common mistakes and application checks across all 81 workplace cases and method lessons.
Download Facilitator guide PDF · 166 pages · 65.1 MB OPEXSTUDIO
Understand how the methods relate before selecting a detailed lesson.. Follow the visual, practise a decision, then check your thinking.
Fictional teaching examples and AI-generated illustrations. Proposed changes and goals are not achieved results. Use the written instructions and check local conditions before applying a method.
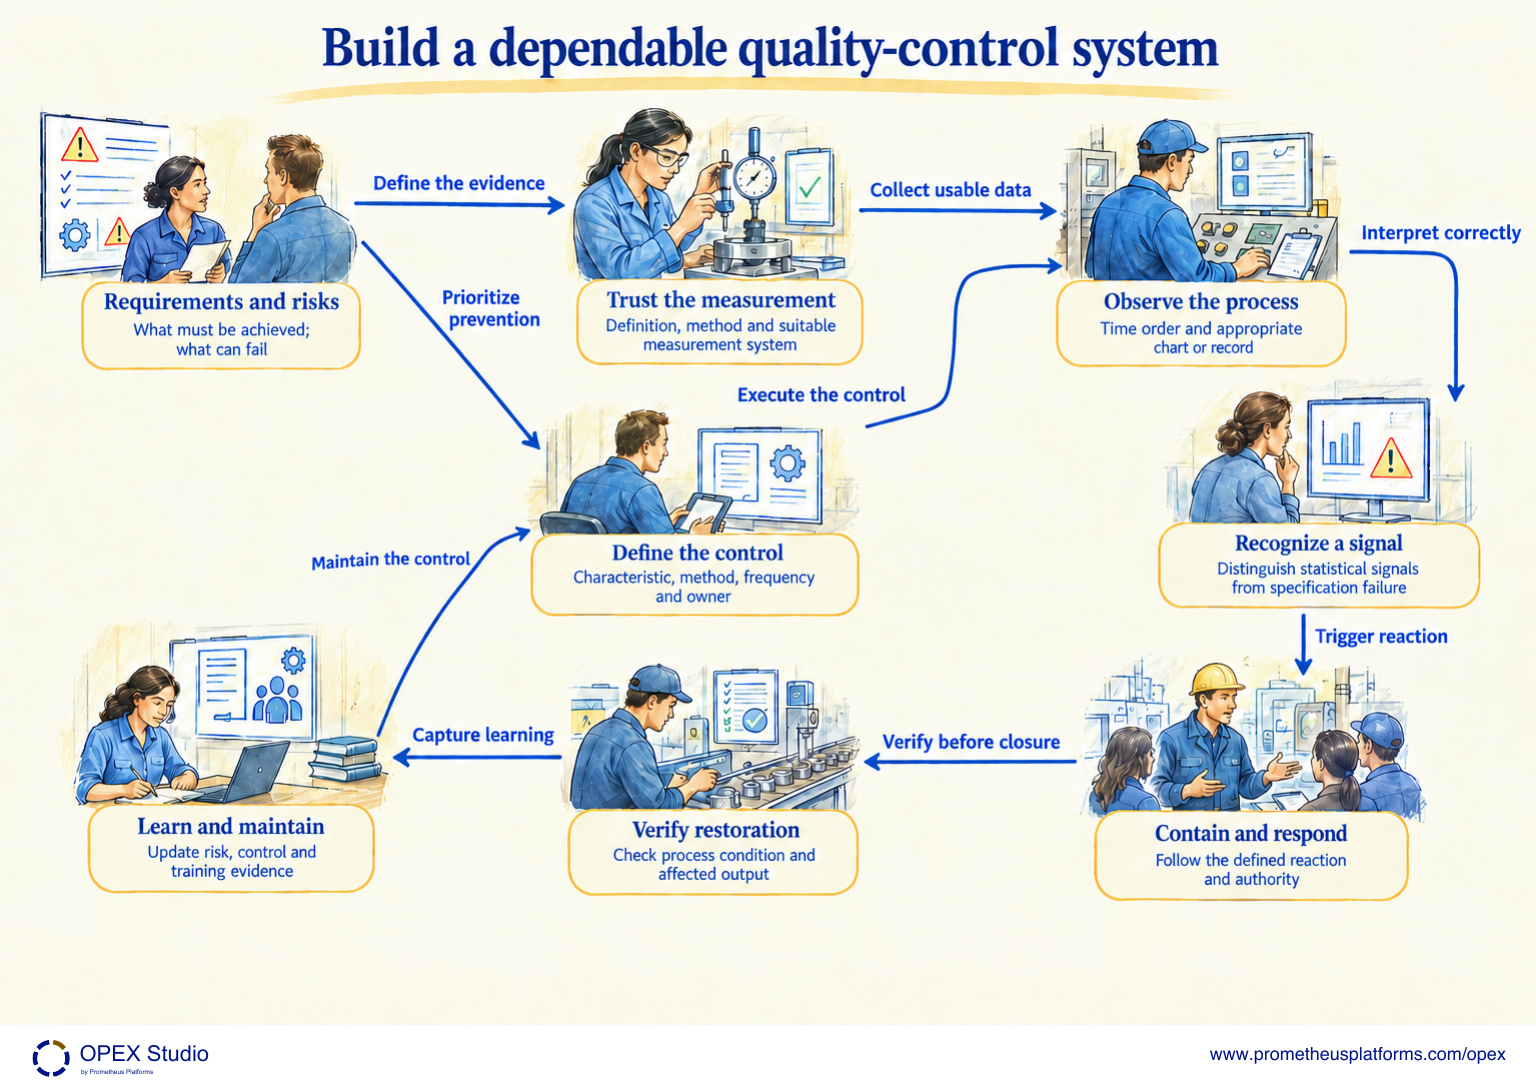
Quality control connects a requirement to an executable routine. Define the characteristic and risk, then establish whether the measurement method can support the intended decision. A control plan names how evidence is collected and who reacts. Time-ordered data may support statistical monitoring, but chart limits do not replace engineering or customer specifications. A signal requires the agreed response, containment where appropriate and verification of restoration. Feed learning into the risk analysis, control plan and training. The map is an introductory relationship model, not a licensed control-plan form or authority to approve product.
Control limits describe process behavior; specification limits express requirements.
Choose a chart from data type and sampling structure.
Containment, correction and verified recurrence prevention are different decisions.
A chart is stable but measurements exceed a specification. Can the team release the product because the chart is in control?
No. Statistical stability and conformity answer different questions. Follow product disposition and the control-plan reaction while investigating capability and relevant causes.
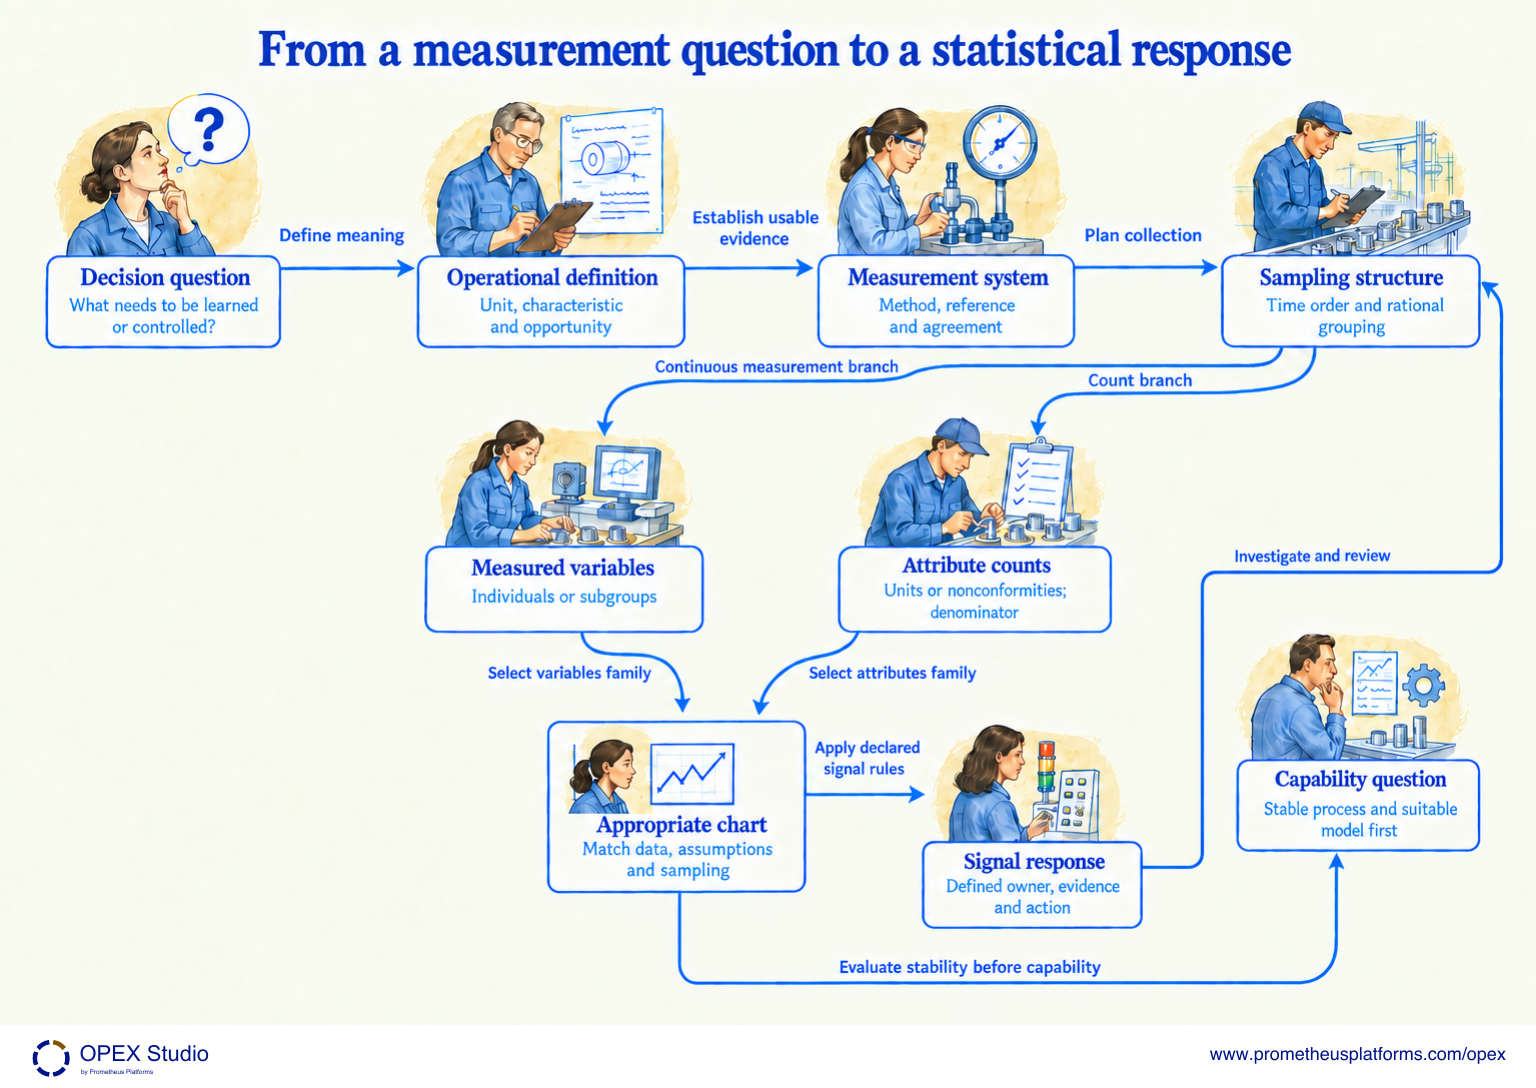
A statistical routine starts with a decision question, not with a favorite chart. Define what is measured, what constitutes a unit or defect and which denominator is relevant. Check the measurement system and preserve collection order and sampling structure. Measured variables and attribute counts require different chart families; even within counts, nonconforming units and nonconformities are different data. Match the chart to these definitions and its assumptions. Agree the signal rules and reaction owner before using it. Capability asks whether a stable process can meet requirements under a suitable model. A chart does not establish conformity, capability or a cause merely by being drawn.
Nonconforming units differ from numbers of nonconformities.
Subgroup structure and time order matter to interpretation.
Capability interpretation requires stability and an appropriate distribution/model; a histogram alone is insufficient.
The same unit can contain several scratches, and inspected surface area varies. Why is a fixed-size defective-unit chart not automatically appropriate?
Clarify whether the decision counts scratched units or individual scratches. For nonconformities, preserve the exposure denominator and evaluate a suitable rate chart and assumptions. Do not select a chart from the word defect alone.
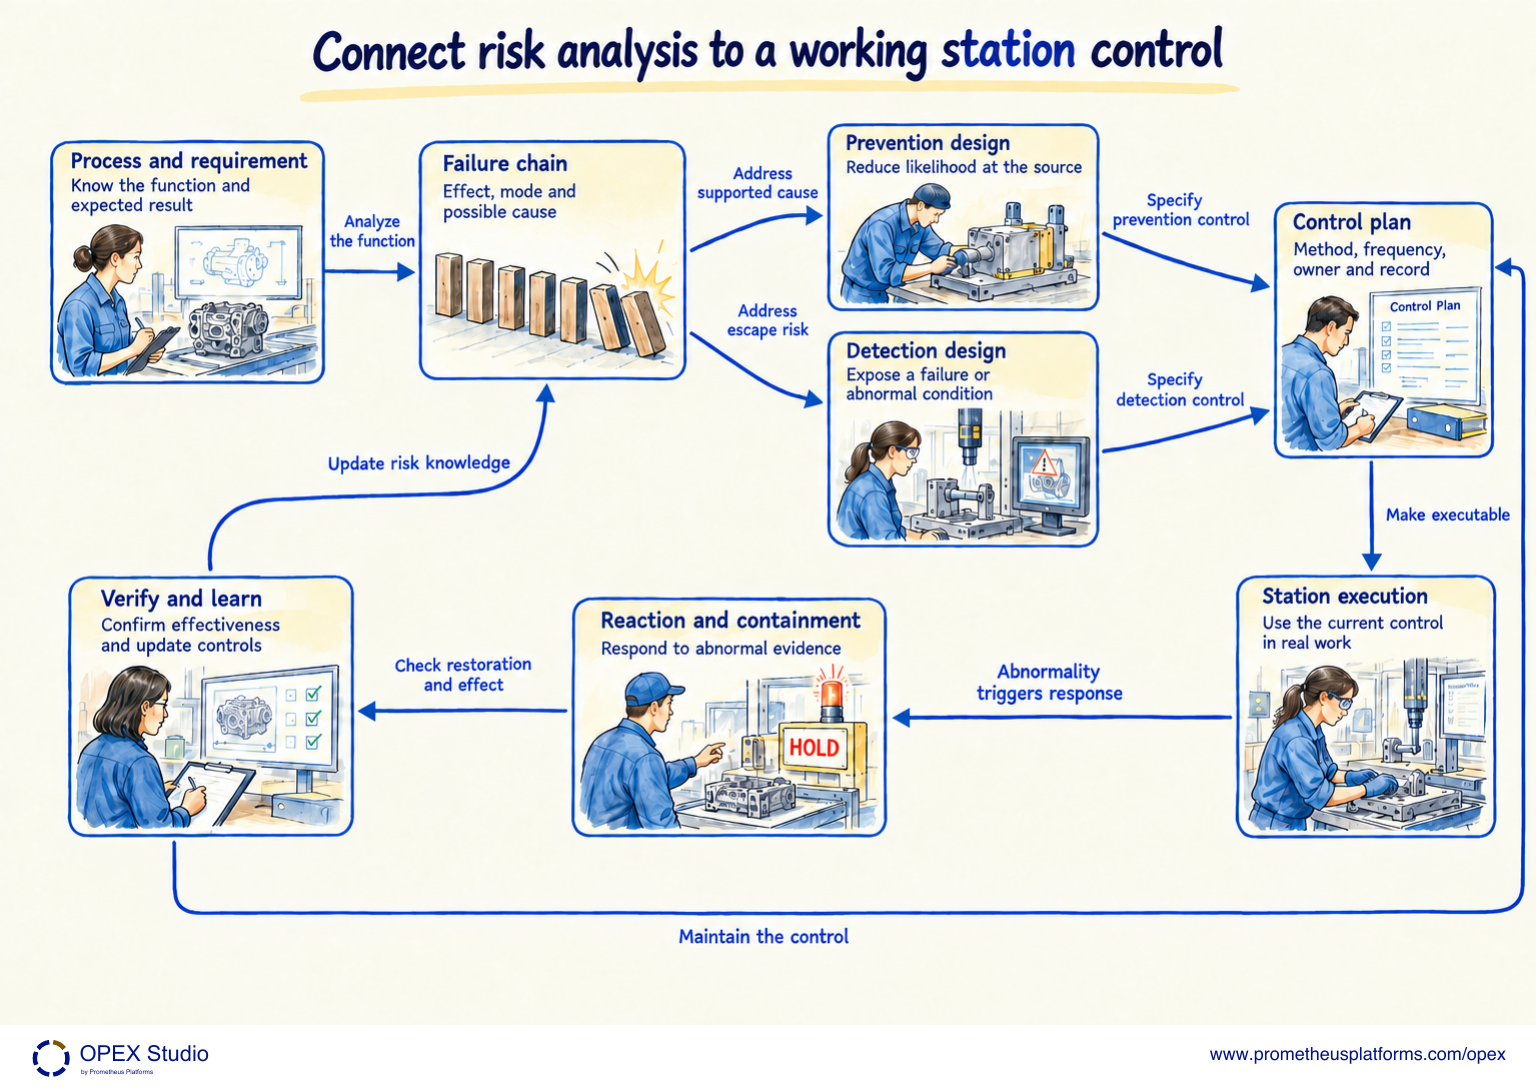
Risk analysis should connect the process function to plausible failure modes, effects and causes. Prevention and detection have different roles: preventing incorrect assembly differs from detecting it and stopping release. Translate the selected controls into an executable plan with a method, frequency, owner, record and reaction. Then observe whether the station actually uses the current control. A layered process audit checks execution of critical controls; it does not replace product verification. When an abnormality occurs, protect affected output, restore the process under the defined authority and verify the effect. Feed evidence back to both the risk analysis and the control plan.
A detection-and-stop device is not the same as error prevention.
FMEA prioritization depends on the required method; no rating or Action Priority tables are reproduced.
An audit completion mark is not product-release evidence.
A sensor detects reversed parts but the line continues and no owner handles the alert. Which link is missing?
The detection is not connected to an effective reaction and release boundary. Define the stop or hold response, responsible owner, restoration verification and record; then test the complete control, not only the sensor.
Control plans link process risks and controls, with explicit reaction ownership, containment and return-to-control actions.
Public overview only. Do not reproduce licensed forms or infer a universal sampling frequency or safe-launch exit period.Chart selection distinguishes measured variables, attributes and multivariate statistics.
Public primary-source summary; underlying paid standards/forms are not reproduced.Nonconforming units differ from counts of nonconformities; p, c and u charts address different data definitions.
Public primary-source summary; underlying paid standards/forms are not reproduced.Control charts follow a statistic in time, using limits derived from a reference process; nonrandom patterns can matter even within limits.
Public primary-source summary; underlying paid standards/forms are not reproduced.Statistical stability does not imply acceptable output; reducing common-cause variation requires process improvement.
Public primary-source summary; underlying paid standards/forms are not reproduced.A signal calls for the process-specific out-of-control action plan and investigation of an assignable cause.
Public primary-source summary; underlying paid standards/forms are not reproduced.Measurement characterization covers repeatability, reproducibility, stability, bias, resolution, linearity and other error sources.
Public primary-source summary; underlying paid standards/forms are not reproduced.A measurement study needs considered choices of artifacts, operators, gauges and measurement levels.
Public primary-source summary; underlying paid standards/forms are not reproduced.Attribute agreement examines within-appraiser, between-appraiser and reference-standard agreement.
Only the public scope is used; no ISO/TR14468 tables or examples are copied and current standard adoption is not inferred.Capability compares a stable process distribution with specification limits; common indices require explicit distribution and sampling assumptions.
Public primary-source summary; underlying paid standards/forms are not reproduced.The harmonized method uses seven steps and Action Priority instead of RPN-based prioritization.
Do not copy rating/AP tables or invent AP from RPN. Confirm the method required by the customer.Prevent wrong/missing/reversed parts or prevent their passing downstream
Method reference; original OPEX scenario and diagram are synthetic teaching content, not source case results.Process-specific checks, cross-functional ownership and management review connect audits to meaningful performance outcomes.
Public primary-source summary; underlying paid standards/forms are not reproduced.Read the lessons online or use these PDFs to prepare, practise and review with your team. No sign-in needed.
Case objectives, demonstration plans, debriefs, common mistakes and application checks across all 81 workplace cases and method lessons.
Download Facilitator guide PDF · 166 pages · 65.1 MBPrintable case worksheets, blank observation records and five calculation exercises; answers are separate.
Download Learner workbook PDF · 169 pages · 10.7 MBReasoned sample responses, worked calculations and coaching guidance; fictional examples are clearly labelled.
Download Answer key and coaching notes PDF · 105 pages · 8.5 MBThe native method mechanisms and worked applications for all 68 detailed lessons, in a separate bookmarked portrait reference.
Download Method and application reference PDF · 141 pages · 10.2 MBFive illustrated system chapters: 15 Flare concept maps and 26 original workplace teaching cards, with links to all 81 supporting cases and method lessons.
Download Illustrated systems atlas PDF · 69 pages · 55.8 MBPrimary teaching mechanism belongs to quality control and dependable evidence. Supporting links identify application dependencies; they do not make the methods interchangeable.
Explore the connected method →Primary teaching mechanism belongs to quality control and dependable evidence. Supporting links identify application dependencies; they do not make the methods interchangeable.
Explore the connected method →Primary teaching mechanism belongs to quality control and dependable evidence. Supporting links identify application dependencies; they do not make the methods interchangeable.
Explore the connected method →Primary teaching mechanism belongs to quality control and dependable evidence. Supporting links identify application dependencies; they do not make the methods interchangeable.
Explore the connected method →Primary teaching mechanism belongs to quality control and dependable evidence. Supporting links identify application dependencies; they do not make the methods interchangeable.
Explore the connected method →Primary teaching mechanism belongs to quality control and dependable evidence. Supporting links identify application dependencies; they do not make the methods interchangeable.
Explore the connected method →Primary teaching mechanism belongs to quality control and dependable evidence. Supporting links identify application dependencies; they do not make the methods interchangeable.
Explore the connected method →Primary teaching mechanism belongs to quality control and dependable evidence. Supporting links identify application dependencies; they do not make the methods interchangeable.
Explore the connected method →Primary teaching mechanism belongs to quality control and dependable evidence. Supporting links identify application dependencies; they do not make the methods interchangeable.
Explore the connected method →Primary teaching mechanism belongs to quality control and dependable evidence. Supporting links identify application dependencies; they do not make the methods interchangeable.
Explore the connected method →Primary teaching mechanism belongs to quality control and dependable evidence. Supporting links identify application dependencies; they do not make the methods interchangeable.
Explore the connected method →Primary teaching mechanism belongs to quality control and dependable evidence. Supporting links identify application dependencies; they do not make the methods interchangeable.
Explore the connected method →Primary teaching mechanism belongs to quality control and dependable evidence. Supporting links identify application dependencies; they do not make the methods interchangeable.
Explore the connected method →Primary teaching mechanism belongs to quality control and dependable evidence. Supporting links identify application dependencies; they do not make the methods interchangeable.
Explore the connected method →Primary teaching mechanism belongs to quality control and dependable evidence. Supporting links identify application dependencies; they do not make the methods interchangeable.
Explore the connected method →Primary teaching mechanism belongs to quality control and dependable evidence. Supporting links identify application dependencies; they do not make the methods interchangeable.
Explore the connected method →Primary teaching mechanism belongs to quality control and dependable evidence. Supporting links identify application dependencies; they do not make the methods interchangeable.
Explore the connected method →Primary teaching mechanism belongs to quality control and dependable evidence. Supporting links identify application dependencies; they do not make the methods interchangeable.
Explore the connected method →Primary teaching mechanism belongs to quality control and dependable evidence. Supporting links identify application dependencies; they do not make the methods interchangeable.
Explore the connected method →Primary teaching mechanism belongs to quality control and dependable evidence. Supporting links identify application dependencies; they do not make the methods interchangeable.
Explore the connected method →Primary teaching mechanism belongs to quality control and dependable evidence. Supporting links identify application dependencies; they do not make the methods interchangeable.
Explore the connected method →Primary teaching mechanism belongs to quality control and dependable evidence. Supporting links identify application dependencies; they do not make the methods interchangeable.
Explore the connected method →Primary teaching mechanism belongs to quality control and dependable evidence. Supporting links identify application dependencies; they do not make the methods interchangeable.
Explore the connected method →Primary teaching mechanism belongs to quality control and dependable evidence. Supporting links identify application dependencies; they do not make the methods interchangeable.
Explore the connected method →Primary teaching mechanism belongs to quality control and dependable evidence. Supporting links identify application dependencies; they do not make the methods interchangeable.
Explore the connected method →Primary teaching mechanism belongs to problem solving and verified change. Supporting links identify application dependencies; they do not make the methods interchangeable.
Explore the connected method →Primary teaching mechanism belongs to problem solving and verified change. Supporting links identify application dependencies; they do not make the methods interchangeable.
Explore the connected method →Primary teaching mechanism belongs to problem solving and verified change. Supporting links identify application dependencies; they do not make the methods interchangeable.
Explore the connected method →Primary teaching mechanism belongs to problem solving and verified change. Supporting links identify application dependencies; they do not make the methods interchangeable.
Explore the connected method →Primary teaching mechanism belongs to problem solving and verified change. Supporting links identify application dependencies; they do not make the methods interchangeable.
Explore the connected method →Primary teaching mechanism belongs to problem solving and verified change. Supporting links identify application dependencies; they do not make the methods interchangeable.
Explore the connected method →Primary teaching mechanism belongs to problem solving and verified change. Supporting links identify application dependencies; they do not make the methods interchangeable.
Explore the connected method →Primary teaching mechanism belongs to problem solving and verified change. Supporting links identify application dependencies; they do not make the methods interchangeable.
Explore the connected method →Primary teaching mechanism belongs to problem solving and verified change. Supporting links identify application dependencies; they do not make the methods interchangeable.
Explore the connected method →Primary teaching mechanism belongs to problem solving and verified change. Supporting links identify application dependencies; they do not make the methods interchangeable.
Explore the connected method →Primary teaching mechanism belongs to problem solving and verified change. Supporting links identify application dependencies; they do not make the methods interchangeable.
Explore the connected method →Primary teaching mechanism belongs to problem solving and verified change. Supporting links identify application dependencies; they do not make the methods interchangeable.
Explore the connected method →Primary teaching mechanism belongs to problem solving and verified change. Supporting links identify application dependencies; they do not make the methods interchangeable.
Explore the connected method →Primary teaching mechanism belongs to problem solving and verified change. Supporting links identify application dependencies; they do not make the methods interchangeable.
Explore the connected method →Primary teaching mechanism belongs to problem solving and verified change. Supporting links identify application dependencies; they do not make the methods interchangeable.
Explore the connected method →Primary teaching mechanism belongs to problem solving and verified change. Supporting links identify application dependencies; they do not make the methods interchangeable.
Explore the connected method →Primary teaching mechanism belongs to equipment wellness and oee. Supporting links identify application dependencies; they do not make the methods interchangeable.
Explore the connected method →Primary teaching mechanism belongs to equipment wellness and oee. Supporting links identify application dependencies; they do not make the methods interchangeable.
Explore the connected method →Primary teaching mechanism belongs to equipment wellness and oee. Supporting links identify application dependencies; they do not make the methods interchangeable.
Explore the connected method →Primary teaching mechanism belongs to equipment wellness and oee. Supporting links identify application dependencies; they do not make the methods interchangeable.
Explore the connected method →Primary teaching mechanism belongs to equipment wellness and oee. Supporting links identify application dependencies; they do not make the methods interchangeable.
Explore the connected method →