Facilitator guide
Case objectives, demonstration plans, debriefs, common mistakes and application checks across all 81 workplace cases and method lessons.
Download Facilitator guide PDF · 166 pages · 65.1 MB OPEXSTUDIO
DMAIC + measurement + control. Follow the visual, practise a decision, then check your thinking.
Fictional teaching examples and AI-generated illustrations. Proposed changes and goals are not achieved results. Use the written instructions and check local conditions before applying a method.
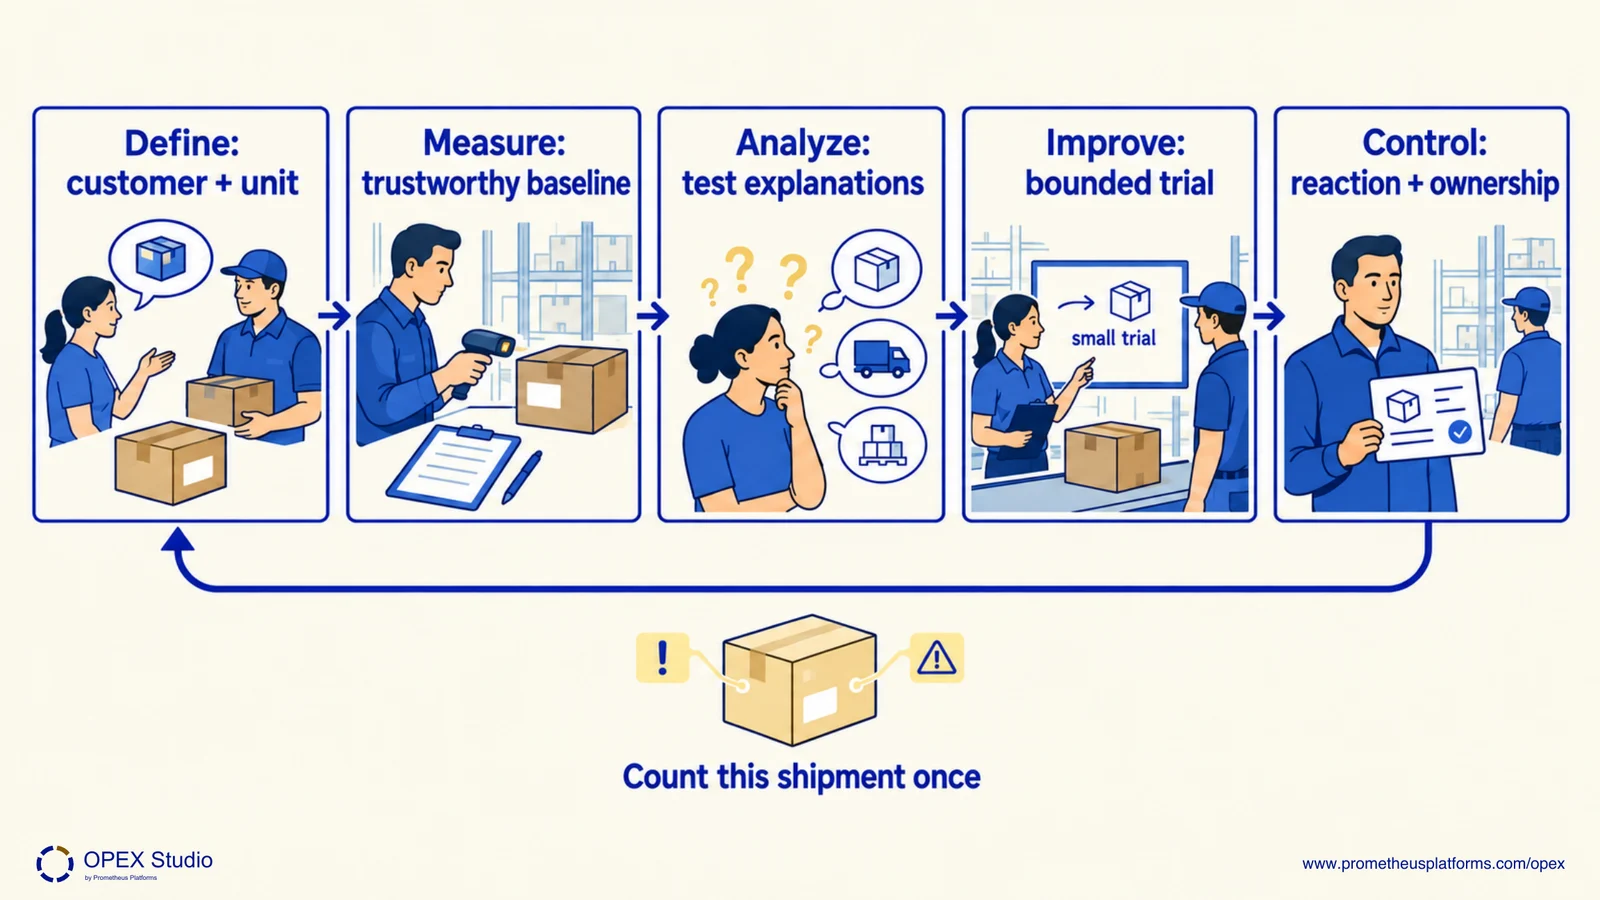
Define a shipment error consistently before counting. The retained baseline is 120 error-containing shipments from 3000 audited shipments, or 4%. Its 66 wrong-SKU, 36 short-quantity and 18 wrong-label counts are primary categories. Validate the recording method, use patterns to guide causal tests, trial a countermeasure, and specify how the process will be monitored afterwards. DMAIC is useful for an existing process whose performance needs improvement.
An error-containing shipment counts once in the shipment-error rate, even if it contains several errors.
Primary classifications total 120: wrong SKU 66, short quantity 36, wrong label 18. Baseline: 120 / 3,000 = 4%.
If one shipment has two errors, can it be counted twice in the 4% shipment measure?
No. Count it once as an error-containing shipment; a separate defects measure would need its own definition.
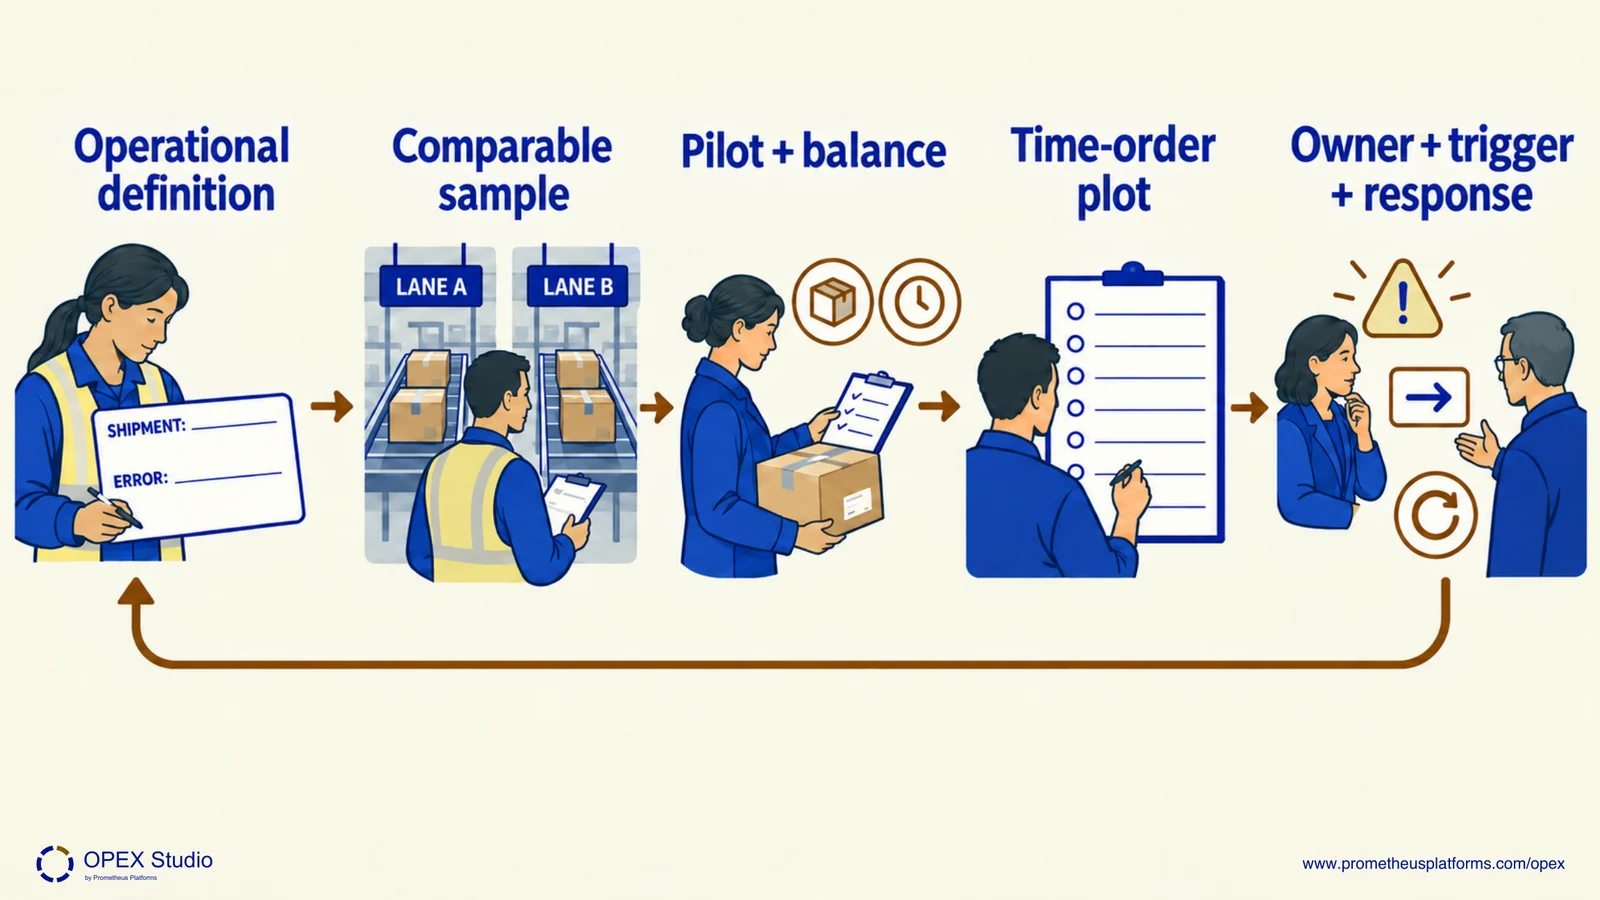
Use the location difference to choose an investigation, not to declare cause. Preserve denominators and compare similar order mixes. Check the proposed error goal of 1% alongside throughput of at least 220 lines per labour-hour. A reaction plan names who checks a signal and what containment or investigation follows. Add a statistical control chart only after selecting a suitable chart and defensible data; a target line is not a control limit.
Adjacent look-alike SKU locations: 90 / 1,000 = 9%. Other locations: 30 / 2,000 = 1.5%. This is an association to investigate.
Trial against the proposed ≤1% error goal while preserving ≥220 lines per labour-hour. Keep order mix and recording definitions comparable.
A target is a desired result. A statistical control limit is derived using an appropriate method and data; no such limits are supplied here.
Why is a Pareto bar not a root-cause conclusion?
It ranks recorded categories; it does not establish the mechanism causing them.
DMAIC improves existing processes by defining the need, establishing trustworthy measurements, analyzing performance drivers, evaluating improvements and maintaining results through standards, measurement and reaction plans.
ASQ distinguishes DMAIC from DMADV for new designs or major redesign.Fishbone diagrams organize possible explanations into categories to support exploration and further analysis.
A diagram branch is a candidate explanation, not automatically a verified cause.Plot time-ordered data and select an appropriate chart; statistically derived control limits support investigation of variation and are not decorative target lines.
Read the lessons online or use these PDFs to prepare, practise and review with your team. No sign-in needed.
Case objectives, demonstration plans, debriefs, common mistakes and application checks across all 81 workplace cases and method lessons.
Download Facilitator guide PDF · 166 pages · 65.1 MBPrintable case worksheets, blank observation records and five calculation exercises; answers are separate.
Download Learner workbook PDF · 169 pages · 10.7 MBReasoned sample responses, worked calculations and coaching guidance; fictional examples are clearly labelled.
Download Answer key and coaching notes PDF · 105 pages · 8.5 MBThe native method mechanisms and worked applications for all 68 detailed lessons, in a separate bookmarked portrait reference.
Download Method and application reference PDF · 141 pages · 10.2 MBFive illustrated system chapters: 15 Flare concept maps and 26 original workplace teaching cards, with links to all 81 supporting cases and method lessons.
Download Illustrated systems atlas PDF · 69 pages · 55.8 MBA recurring serious defect may need immediate containment and occurrence/escape investigation alongside measurement-led improvement.
Explore the connected method →A control plan becomes useful when a named owner responds to its signals and verifies the result.
Explore the connected method →