Facilitator guide
Case objectives, demonstration plans, debriefs, common mistakes and application checks across all 81 workplace cases and method lessons.
Download Facilitator guide PDF · 166 pages · 65.1 MB OPEXSTUDIO
Define what each paired observation represents.. Follow the visual, practise a decision, then check your thinking.
Fictional teaching examples and AI-generated illustrations. Proposed changes and goals are not achieved results. Use the written instructions and check local conditions before applying a method.
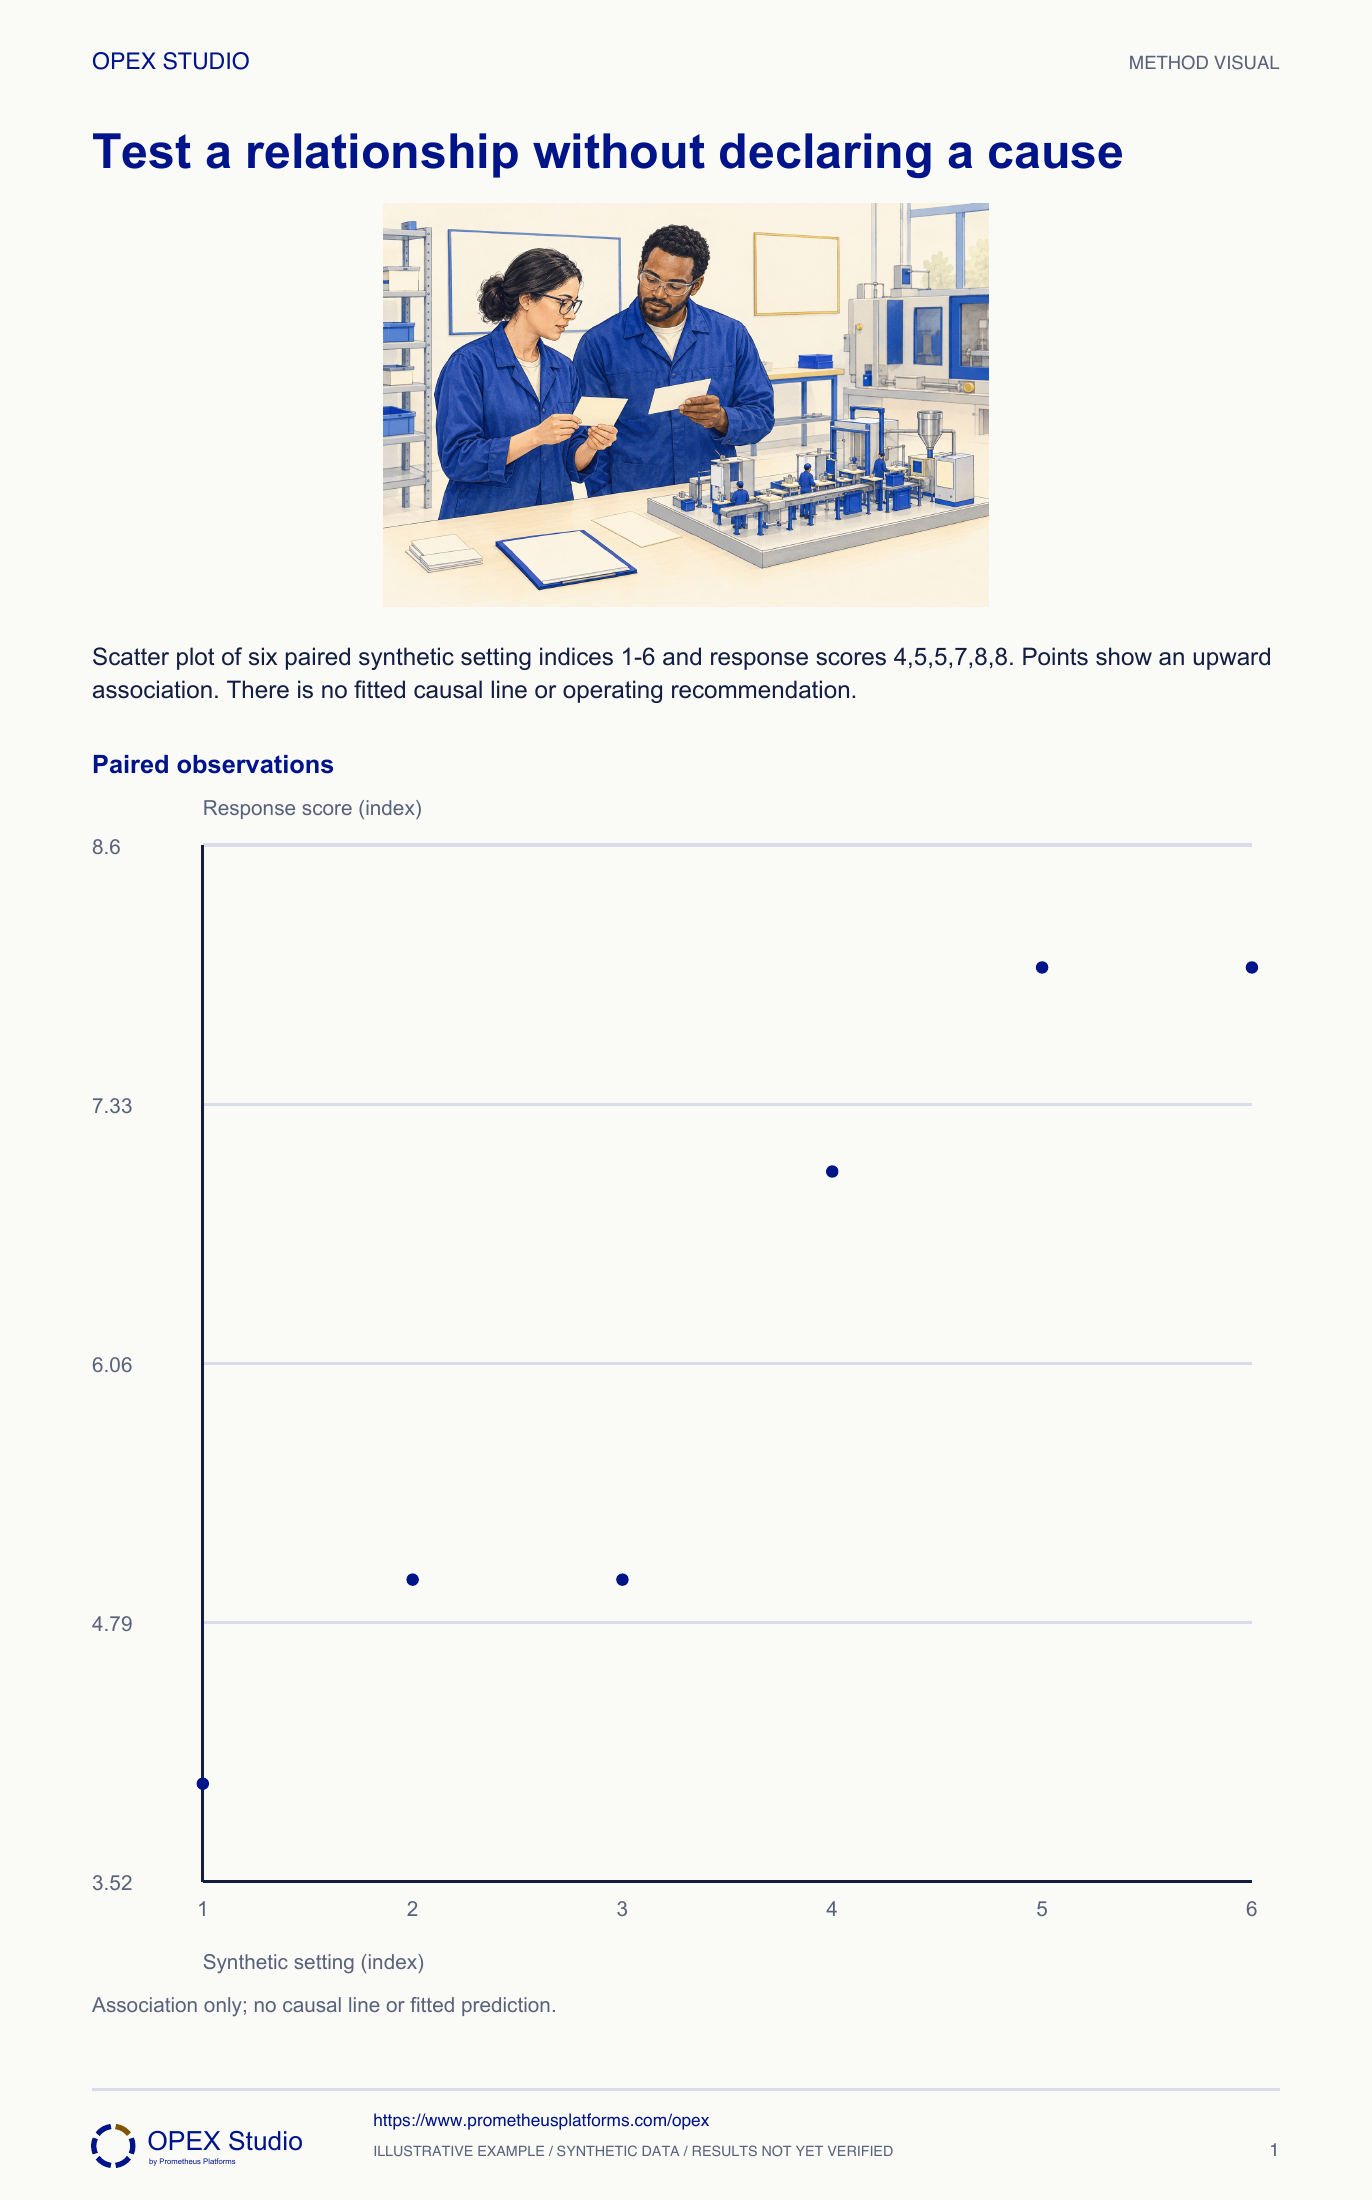
A scatter plot preserves the pairing between two variables. Label both scales and make clear what one point represents. Pair observations from the same relevant unit or time window; arbitrary pairing can manufacture a pattern. An apparent slope is an invitation to investigate, not proof that changing one variable will change the other. Product mix, time, measurement error or an omitted factor may explain the relationship. Preserve source labels and inspect unusual points before fitting a model. A useful next step is a safe, discriminating test that would produce different predictions under the competing explanations.
Paired x=[1,2,3,4,5,6], y=[4,5,5,7,8,8].
Synthetic indices have no equipment operating meaning.
Association remains a hypothesis; no causal fitted line.
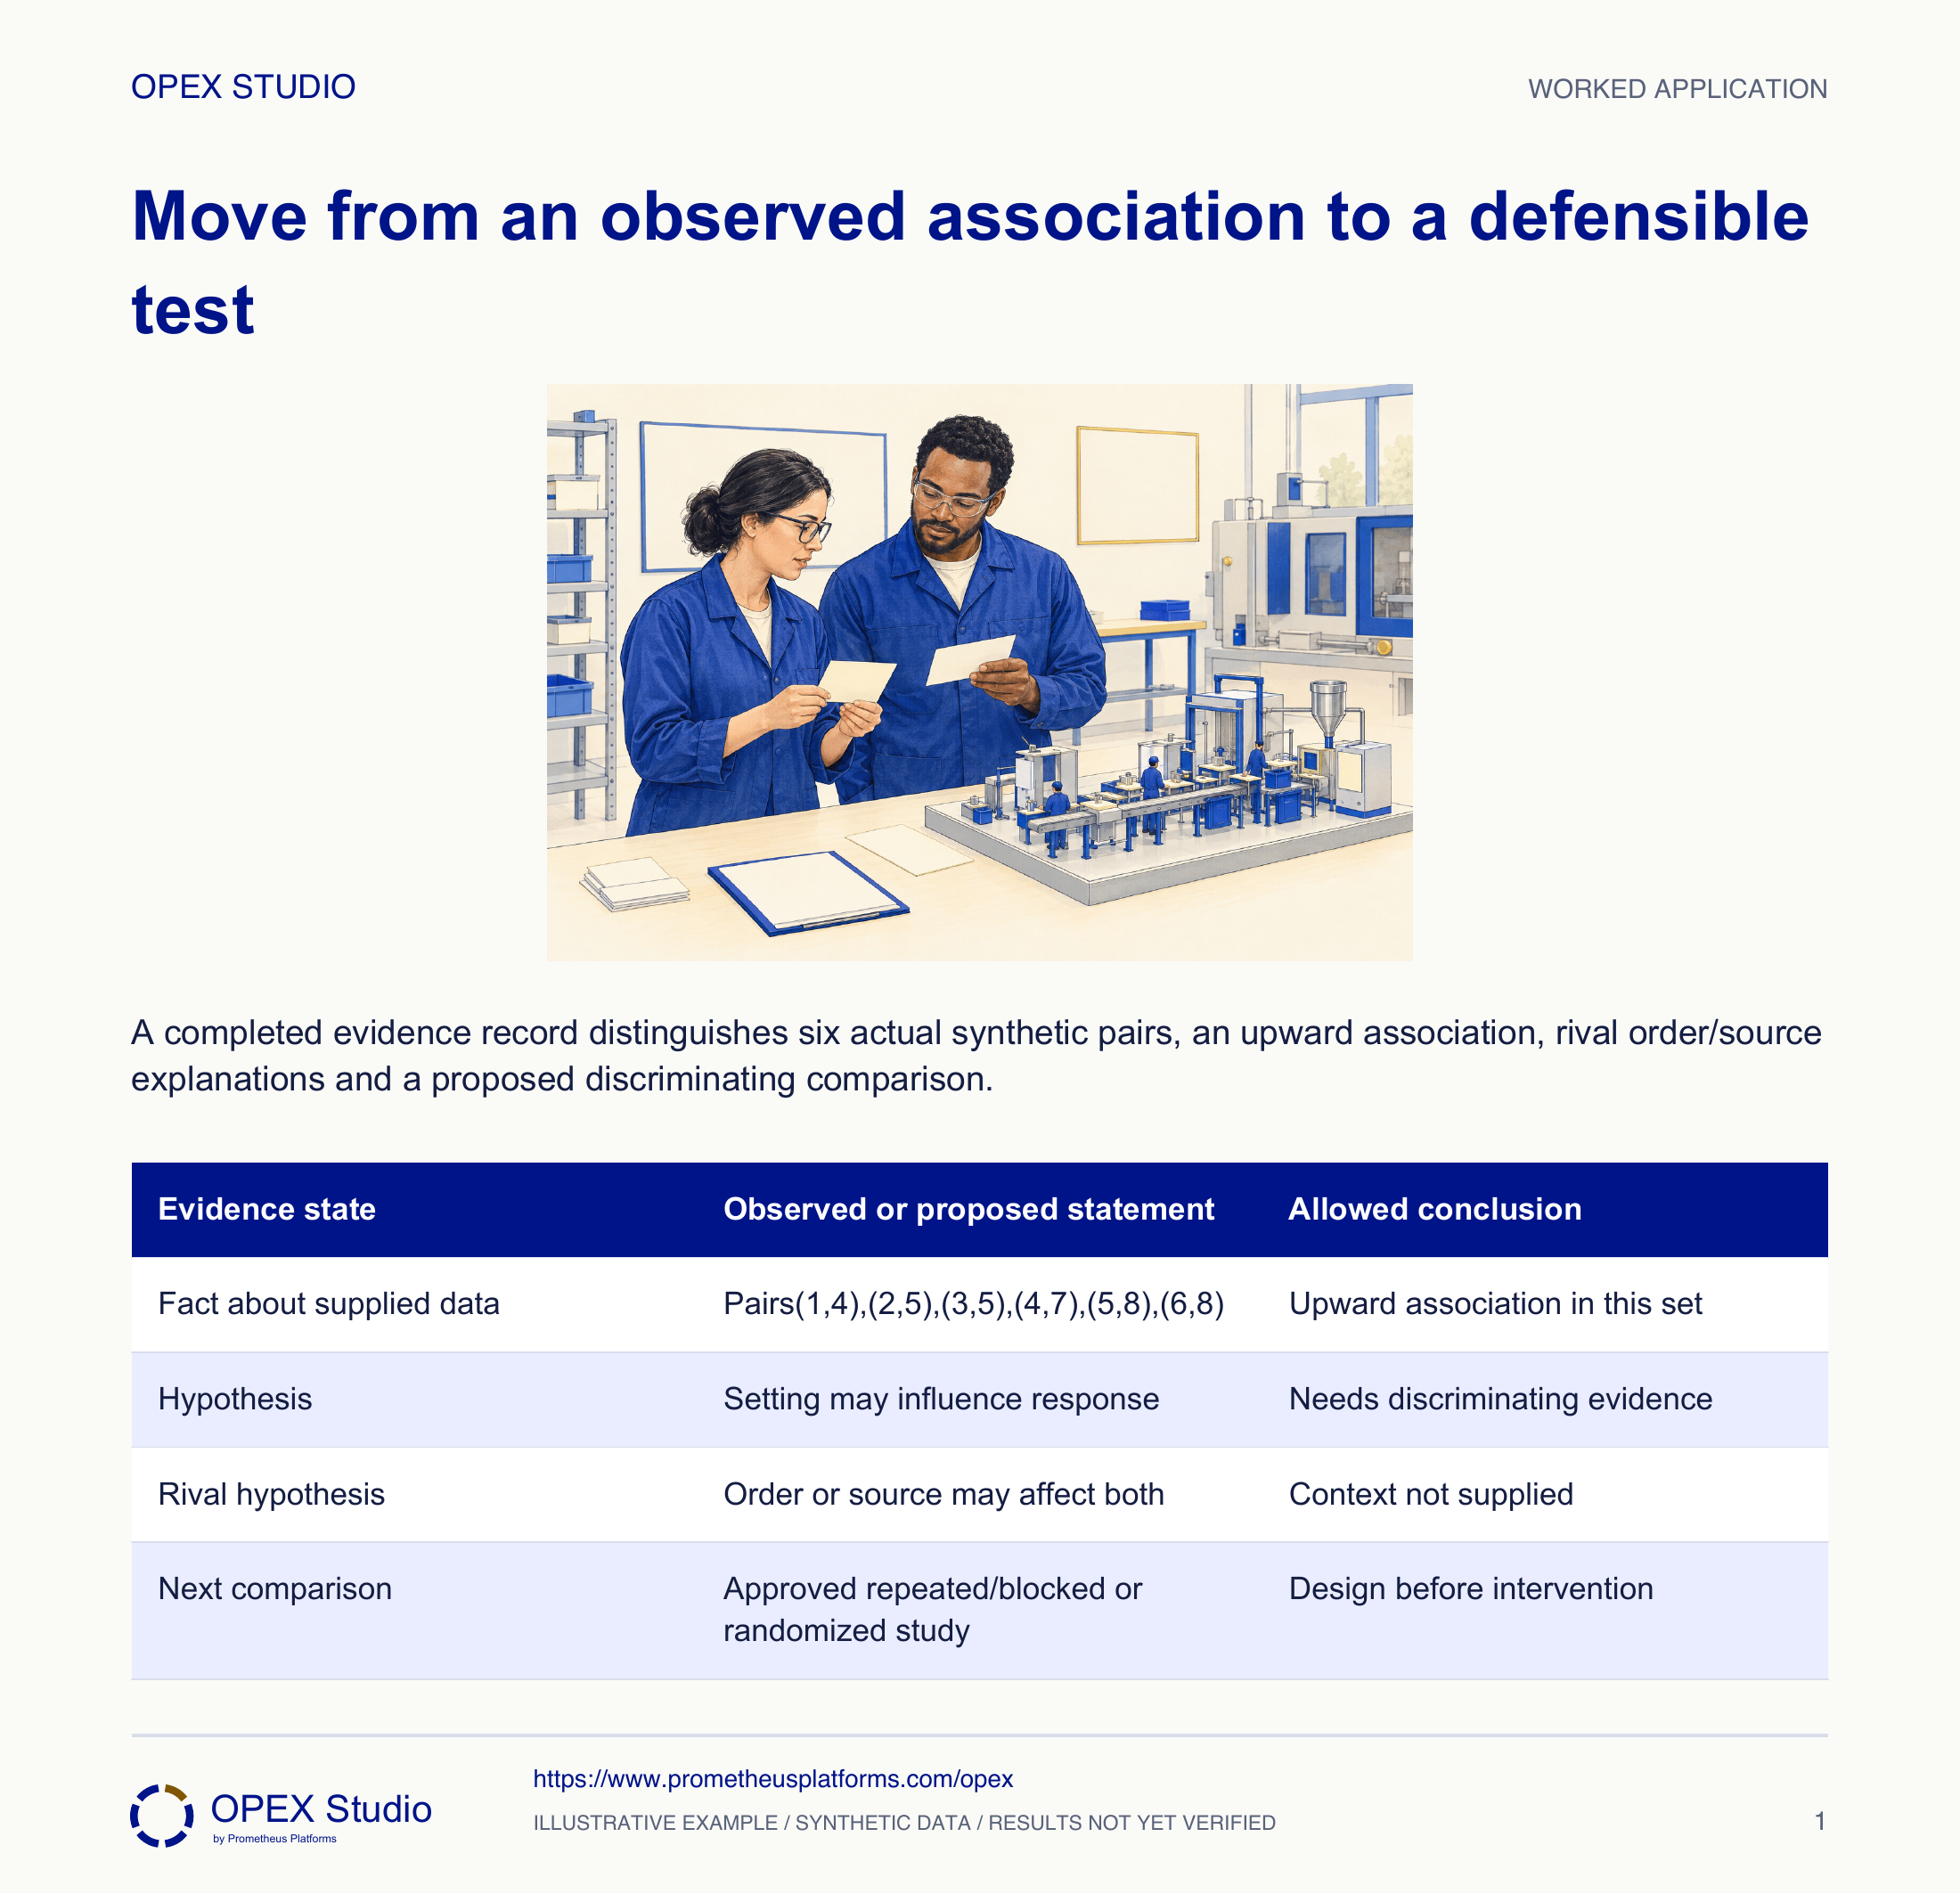
Fictional case: a training simulation pairs setting indices 1–6 with response scores 4,5,5,7,8,8. These exact pairs remain in the core scatter plot. Learner Ben is asked whether increasing the setting causes a better response. The numbers are synthetic indices, with no machine operating meaning or calibrated prediction rule.
Correct the source pairing with a traceable amendment and replot before interpreting. Retain the original mistaken version as an error record if required locally.
The strength or direction of association depends on correct pairs. A visually convenient point must not remain because it supports the preferred story.
Preserve observation pairs, describe an association accurately, and design a next comparison that can distinguish rival explanations.
Fictional case: a training simulation pairs setting indices 1–6 with response scores 4,5,5,7,8,8. These exact pairs remain in the core scatter plot. Learner Ben is asked whether increasing the setting causes a better response. The numbers are synthetic indices, with no machine operating meaning or calibrated prediction rule.
Role: Improvement analyst with the process owner
Each plotted point represents one intact paired observation. Units, context and possible shared influences are recorded; conclusions match the evidence.
The team sorts setting and response separately, then proposes a machine adjustment from the positive-looking graph.
| Observation | Setting index | Response score |
|---|---|---|
| 1 | 1 | 4 |
| 2 | 2 | 5 |
| 3 | 3 | 5 |
| 4 | 4 | 7 |
| 5 | 5 | 8 |
| 6 | 6 | 8 |
Ben identifies the record that links each setting index to its response score. He checks that no measurement has been matched to another observation merely because the columns were sorted.
Why: A scatter plot analyzes joint observations. Independently sorting columns can manufacture a positive relationship even when none existed in the actual records.
Evidence: Every plotted point retains an observation identity.
He labels the horizontal axis synthetic setting index and the vertical axis response score. He plots all six pairs with no causal fitted line or real-machine units.
Why: The graphic should reveal the observations rather than create authority through an impressive trend line. A synthetic scale has no direct operating interpretation.
Evidence: The repeated scores at settings 2/3 and 5/6 remain visible.
Ben describes an upward association in this small supplied set, with equal responses at some adjacent setting values. He does not say every increase produces an improvement.
Why: Association is a property of these observations. It is weaker than a causal or predictive claim and does not resolve the meaning or reliability of the response score.
Evidence: A written interpretation distinguishes the plotted pattern from an intervention claim.
He asks whether observation order, a material change or a different operator moved with the setting. The record lacks those contextual fields, so the competing explanations remain open.
Why: A common influence can move both variables. Missing context should become an evidence request, not a convenient assumption that all other conditions were identical.
Evidence: The investigation record lists setting effect, order effect and source mix as hypotheses.
For the training exercise he sketches repeated comparisons with randomized order or an appropriate blocked design and consistent measurement. A qualified owner must approve any real experiment and operating range.
Why: An experiment needs a design that separates plausible influences and protects the process. This proposal is a reasoning exercise, not permission to alter equipment or choose a PID setting.
Evidence: The next step states what would be held comparable, what would vary and what outcome would challenge the hypothesis.
| Evidence state | Observed or proposed statement | Allowed conclusion |
|---|---|---|
| Fact about supplied data | Pairs(1,4),(2,5),(3,5),(4,7),(5,8),(6,8) | Upward association in this set |
| Hypothesis | Setting may influence response | Needs discriminating evidence |
| Rival hypothesis | Order or source may affect both | Context not supplied |
| Next comparison | Approved repeated/blocked or randomized study | Design before intervention |
The response 8 originally paired with setting 5 is found to belong to another observation.
Correct the source pairing with a traceable amendment and replot before interpreting. Retain the original mistaken version as an error record if required locally.
The strength or direction of association depends on correct pairs. A visually convenient point must not remain because it supports the preferred story.
The amended observation ID explains which point changed and why.
New synthetic pairs are(1,6),(2,4),(3,7),(4,5). A presenter sorts responses into 4,5,6,7 while leaving settings 1,2,3,4 and claims a steady increase.
| Setting | Actual paired response |
|---|---|
| 1 | 6 |
| 2 | 4 |
| 3 | 7 |
| 4 | 5 |
The correct points remain(1,6),(2,4),(3,7),(4,5); they do not show a steady increase. Sorting the response column independently invented different observations.
Record time/order or source identity and design an authorized comparison that separates setting from that influence. No causal conclusion follows from correcting the graph alone.
| Setting | Correct response | Sorted-column error |
|---|---|---|
| 1 | 6 | Would wrongly become 4 |
| 2 | 4 | Would wrongly become 5 |
| 3 | 7 | Would wrongly become 6 |
| 4 | 5 | Would wrongly become 7 |
What makes two values a pair?
Which sentence is supported and which is causal?
Compare actual and invented pairs.
What design would separate setting from order?
Plot the changed pairs by hand, then label each conclusion as observation, hypothesis or proposed test.
Owner: Process analyst with an authorized experiment owner
Record: Paired source record, inference note and approved comparison plan
Review: Before any trial and after each reviewed result
Evidence: Pair integrity, controlled context and evidence that discriminates between explanations
Collect missing context or redesign the study rather than treating correlation as a command.
Plot paired numerical observations to examine association; an apparent relationship alone does not establish causation.
Public primary-source summary; underlying paid standards/forms are not reproduced.Read the lessons online or use these PDFs to prepare, practise and review with your team. No sign-in needed.
Case objectives, demonstration plans, debriefs, common mistakes and application checks across all 81 workplace cases and method lessons.
Download Facilitator guide PDF · 166 pages · 65.1 MBPrintable case worksheets, blank observation records and five calculation exercises; answers are separate.
Download Learner workbook PDF · 169 pages · 10.7 MBReasoned sample responses, worked calculations and coaching guidance; fictional examples are clearly labelled.
Download Answer key and coaching notes PDF · 105 pages · 8.5 MBThe native method mechanisms and worked applications for all 68 detailed lessons, in a separate bookmarked portrait reference.
Download Method and application reference PDF · 141 pages · 10.2 MBFive illustrated system chapters: 15 Flare concept maps and 26 original workplace teaching cards, with links to all 81 supporting cases and method lessons.
Download Illustrated systems atlas PDF · 69 pages · 55.8 MBExplore this connected method and its separate application conditions.
Explore the connected method →Explore this connected method and its separate application conditions.
Explore the connected method →Explore this connected method and its separate application conditions.
Explore the connected method →