Facilitator guide
Case objectives, demonstration plans, debriefs, common mistakes and application checks across all 81 workplace cases and method lessons.
Download Facilitator guide PDF · 166 pages · 65.1 MB OPEXSTUDIO
Define the inspected unit and each nonconformity category.. Follow the visual, practise a decision, then check your thinking.
Fictional teaching examples and AI-generated illustrations. Proposed changes and goals are not achieved results. Use the written instructions and check local conditions before applying a method.
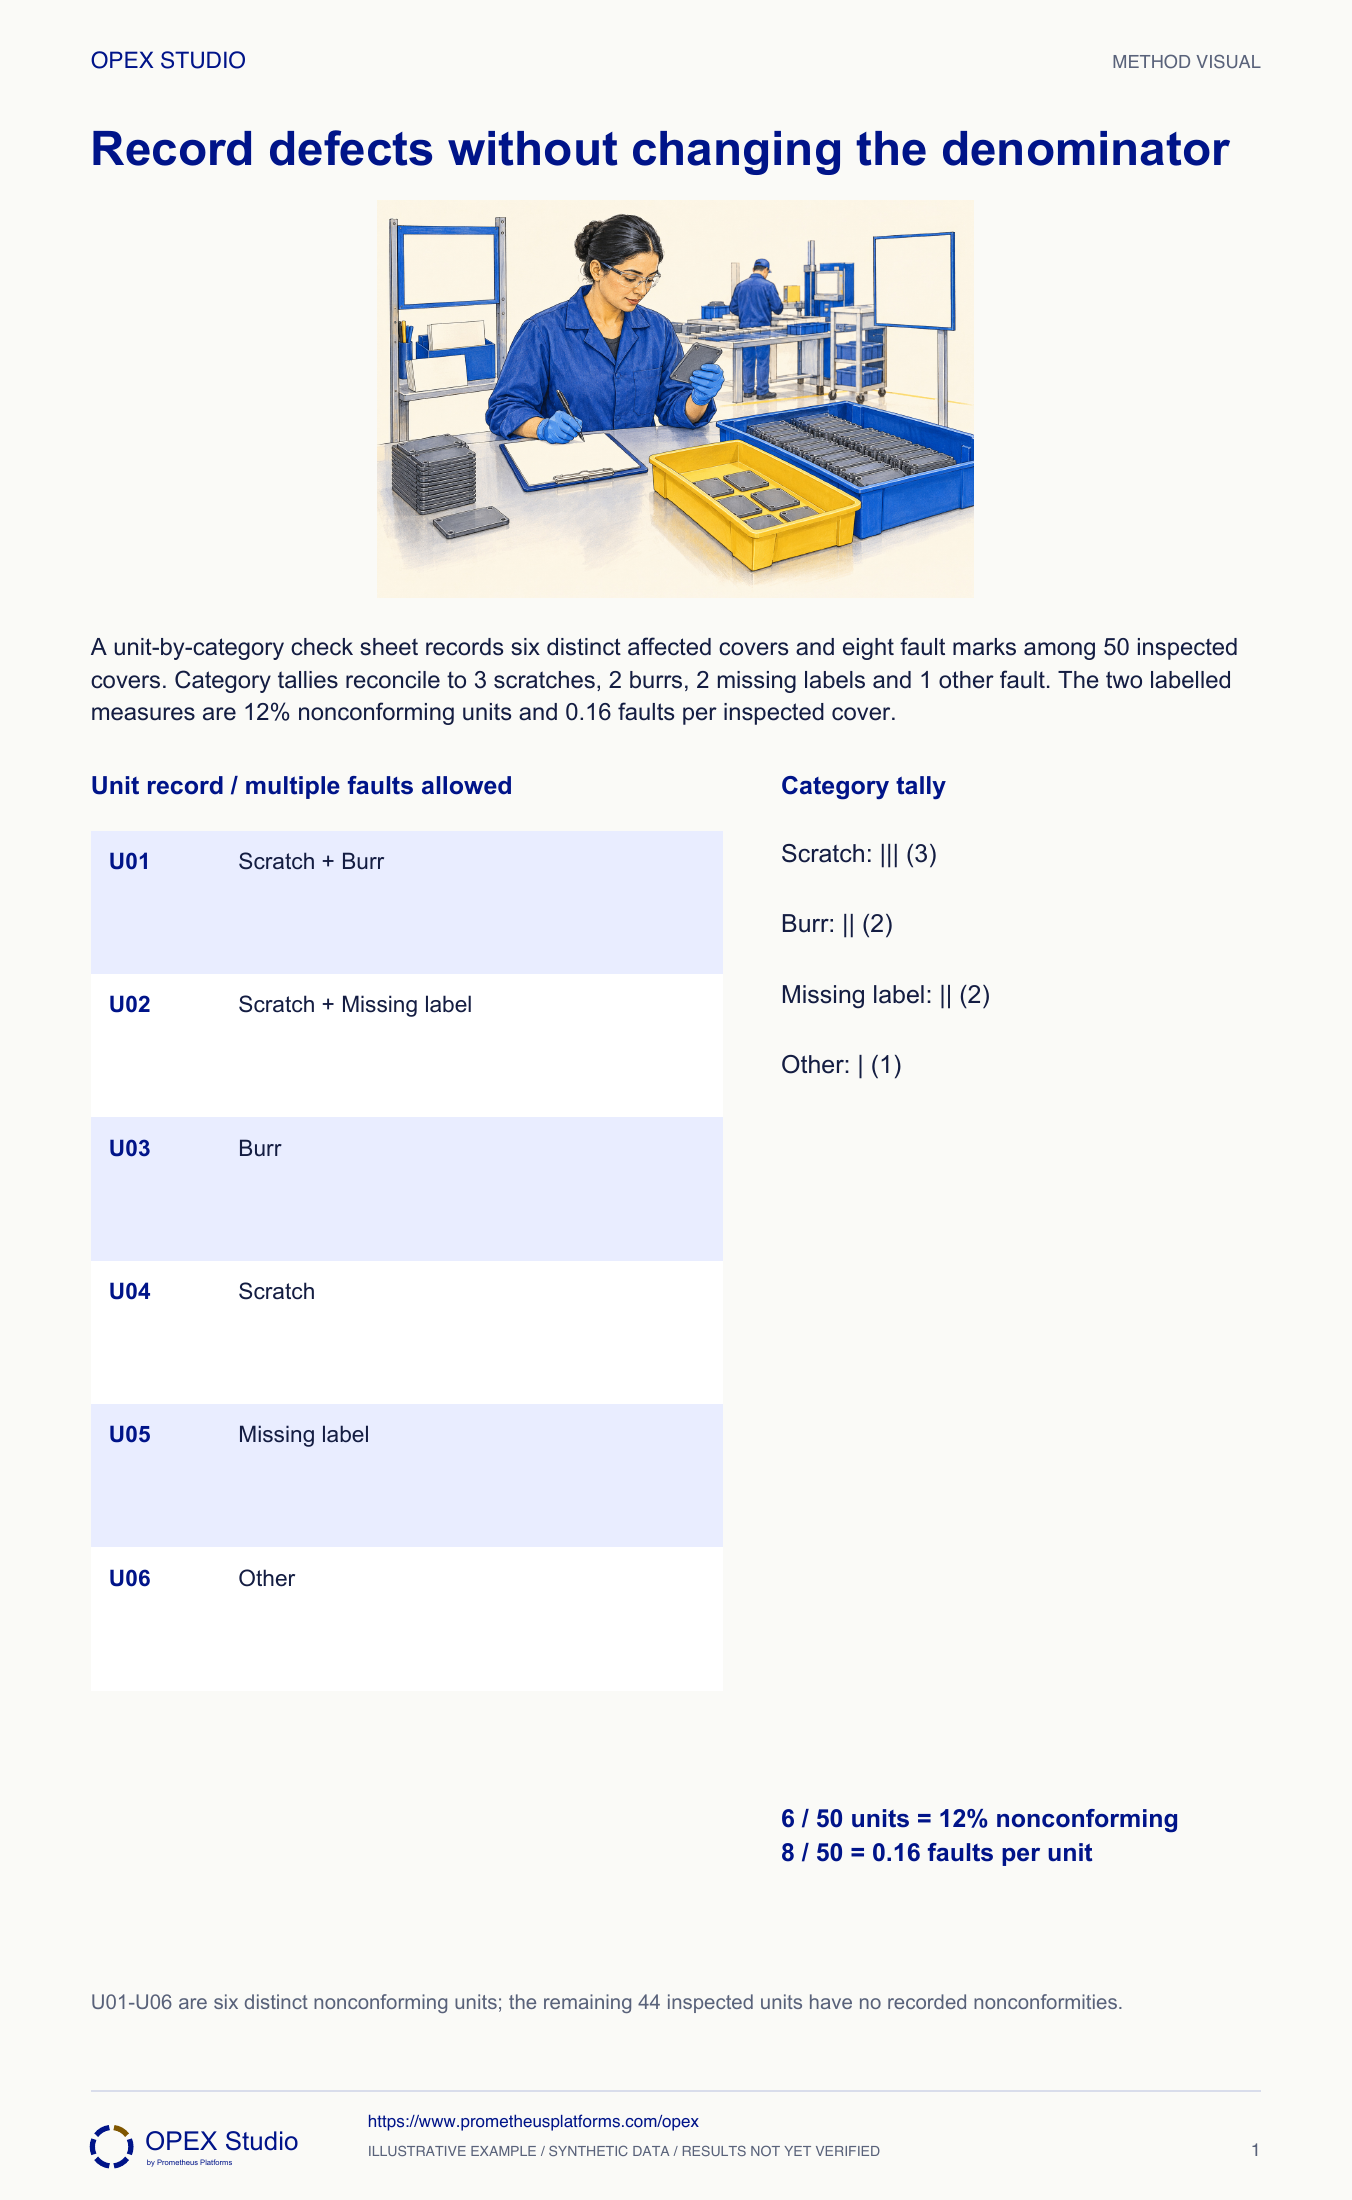
A useful check sheet makes the unit of observation visible. One rejected product can contain several distinct nonconformities, so a tally of faults is not automatically a count of failed products. Define each category, the inspection opportunity and the observation window before recording. Pilot the sheet with more than one observer and resolve ambiguous classifications. Keep identifiers or source labels that enable a later investigation without collecting unnecessary personal data. Record the denominator alongside the tally. Only then calculate a rate or compare shifts; a larger count may simply reflect a larger amount inspected.
50 inspected; 6 nonconforming units; 8 nonconformities.
12% of units are nonconforming.
0.16 nonconformities per unit is a different measure.
Fictional case: an incoming-inspection team checks 50 covers during one defined receipt window. The core illustration retains six nonconforming units and eight nonconformities. Inspector Arun must produce a record that another inspector can reproduce. The supervisor has called both numbers “rejects”, making the reported rate ambiguous.
Reconcile against U01’s original observation, correct the duplicate with a traceable amendment, and preserve the legitimate burr entry.
Correcting a duplicate is not deleting an inconvenient result. The source record and amendment explain why the total changes.
Record one inspection consistently and reconcile nonconforming units separately from the total number of nonconformities.
Fictional case: an incoming-inspection team checks 50 covers during one defined receipt window. The core illustration retains six nonconforming units and eight nonconformities. Inspector Arun must produce a record that another inspector can reproduce. The supervisor has called both numbers “rejects”, making the reported rate ambiguous.
Role: Incoming inspector and quality record owner
Each inspected cover has one identity; every observed category is recorded once under an agreed definition; total inspected units and affected-unit count remain explicit.
U01 and U02 each have two different faults. Counting every mark as a different rejected cover would exaggerate the fraction of units affected.
| Unit or population | Recorded condition |
|---|---|
| U01 | Scratch and burr |
| U02 | Scratch and missing label |
| U03 / U04 | Burr / scratch respectively |
| U05 / U06 | Missing label / other respectively |
| Remaining 44 covers | No recorded nonconformity in this inspection |
Arun defines the inspected unit as one cover and clarifies the scratch, burr, missing-label and other categories with examples. The team records uncertainty for adjudication instead of guessing a category.
Why: A neat tally is unreliable when inspectors apply different definitions. A check sheet is a collection form; ticking a procedural checklist is a different use.
Evidence: The sheet states unit, window, categories and the rule for ambiguous observations.
Two inspectors independently classify a small set before live collection. They discuss ambiguous examples and revise wording before the receipt window starts.
Why: The pilot exposes unusable categories or insufficient writing space. Agreement during discussion does not by itself establish a complete measurement-system study.
Evidence: The released form has a revision and the agreed observation instructions.
Arun enters U01 through U06 once each and retains both categories on U01 and U02. He records the total population inspected, including the 44 with no recorded faults.
Why: Fault tallies without the inspected population cannot yield a unit rate. Multiple faults on one unit are permitted and must not create duplicate units.
Evidence: Six distinct affected IDs; eight category marks; fifty inspected IDs accounted for.
He sums category counts: scratches 3, burrs 2, missing labels 2 and other 1. He separately counts the six unique affected units.
Why: The sum of category marks answers how many nonconformities were observed. A distinct-unit count answers how many inspected units were affected.
Evidence: 3 + 2 + 2 + 1 = 8 faults; six unique nonconforming units.
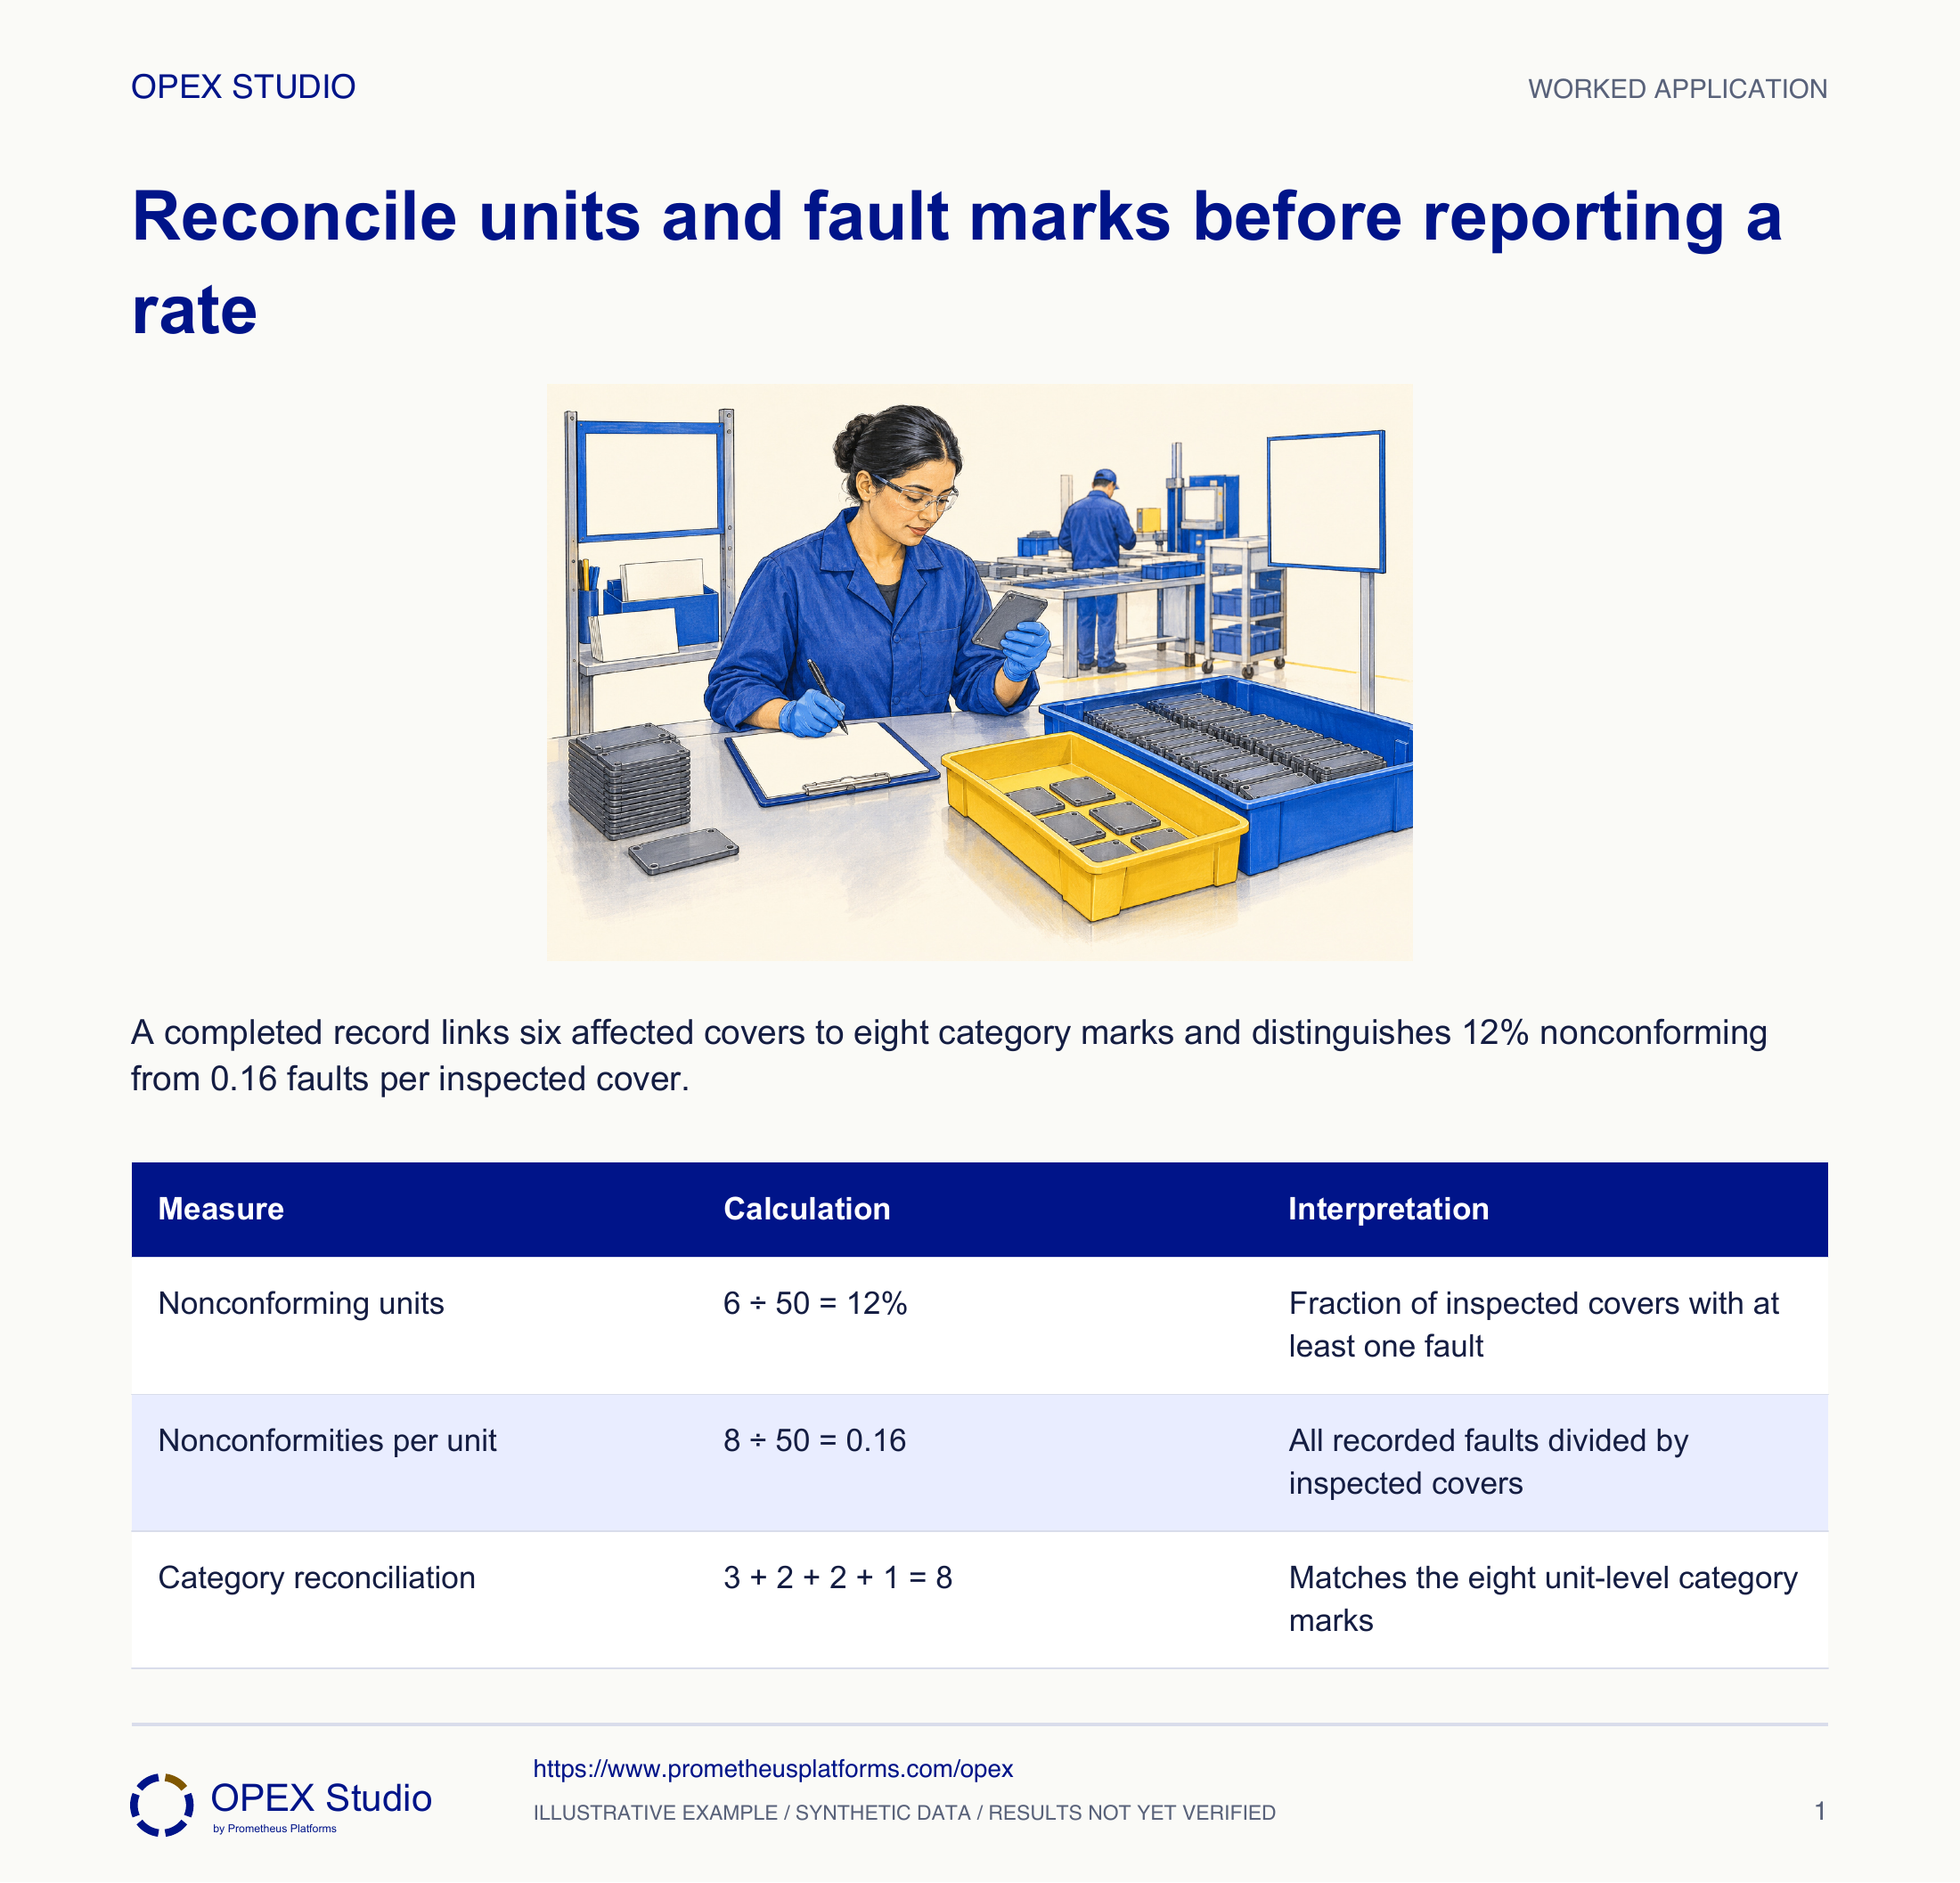
The report states 6/50 = 12% nonconforming units and 8/50 = 0.16 nonconformities per inspected unit. Both retain the window and inspection scope.
Why: These rates answer different questions. Neither says that 16% of units failed, and neither establishes a process trend from this one window.
Evidence: A reviewer can trace each numerator and denominator to the same source sheet.
| Measure | Calculation | Interpretation |
|---|---|---|
| Nonconforming units | 6 ÷ 50 = 12% | Fraction of inspected covers with at least one fault |
| Nonconformities per unit | 8 ÷ 50 = 0.16 | All recorded faults divided by inspected covers |
| Category reconciliation | 3 + 2 + 2 + 1 = 8 | Matches the eight unit-level category marks |
A second transcription of U01’s same scratch appears in the summary.
Reconcile against U01’s original observation, correct the duplicate with a traceable amendment, and preserve the legitimate burr entry.
Correcting a duplicate is not deleting an inconvenient result. The source record and amendment explain why the total changes.
Corrected category count refers to one scratch observation on U01, not two.
New fictional receipt: 40 covers are inspected. A has scratch+burr, B has scratch, C has missing label, D has burr+missing label. The other 36 have no recorded fault.
| Affected ID | Faults |
|---|---|
| A | Scratch, burr |
| B | Scratch |
| C | Missing label |
| D | Burr, missing label |
Four distinct affected units out of 40 gives 10%. Six nonconformities out of 40 gives 0.15 per inspected unit.
Scratches, burrs and missing labels each occur twice. Their sum is six. An uninspected cover must not silently enter the inspected denominator; either inspect it under the defined scope or report the actual inspection amount.
| Measure | Numerator / denominator | Result |
|---|---|---|
| Nonconforming units | 4 / 40 | 10% |
| Nonconformities per unit | 6 / 40 | 0.15 |
| Category totals | 2 + 2 + 2 | 6 |
Can one cover contribute two marks?
Keep U01 visible while calculating both numerators.
Where does each of the six marks come from?
What information would a tally-only summary lose?
Draw the four affected practice units before doing the arithmetic.
Owner: Inspection process owner
Record: Released collection form and reconciled summary
Review: After the pilot and at the next scheduled data review
Evidence: Different reviewers reproduce the counts from the same original records
Correct definitions, training or record capture before comparing rates across windows.
Define the observed event, collection period and recording fields; pilot the form before repeated use.
Public primary-source summary; underlying paid standards/forms are not reproduced.Read the lessons online or use these PDFs to prepare, practise and review with your team. No sign-in needed.
Case objectives, demonstration plans, debriefs, common mistakes and application checks across all 81 workplace cases and method lessons.
Download Facilitator guide PDF · 166 pages · 65.1 MBPrintable case worksheets, blank observation records and five calculation exercises; answers are separate.
Download Learner workbook PDF · 169 pages · 10.7 MBReasoned sample responses, worked calculations and coaching guidance; fictional examples are clearly labelled.
Download Answer key and coaching notes PDF · 105 pages · 8.5 MBThe native method mechanisms and worked applications for all 68 detailed lessons, in a separate bookmarked portrait reference.
Download Method and application reference PDF · 141 pages · 10.2 MBFive illustrated system chapters: 15 Flare concept maps and 26 original workplace teaching cards, with links to all 81 supporting cases and method lessons.
Download Illustrated systems atlas PDF · 69 pages · 55.8 MBExplore this connected method and its separate application conditions.
Explore the connected method →Explore this connected method and its separate application conditions.
Explore the connected method →Explore this connected method and its separate application conditions.
Explore the connected method →Explore this connected method and its separate application conditions.
Explore the connected method →Explore this connected method and its separate application conditions.
Explore the connected method →