Facilitator guide
Case objectives, demonstration plans, debriefs, common mistakes and application checks across all 81 workplace cases and method lessons.
Download Facilitator guide PDF · 166 pages · 65.1 MB OPEXSTUDIO
Identify the baseline source and time order.. Follow the visual, practise a decision, then check your thinking.
Fictional teaching examples and AI-generated illustrations. Proposed changes and goals are not achieved results. Use the written instructions and check local conditions before applying a method.
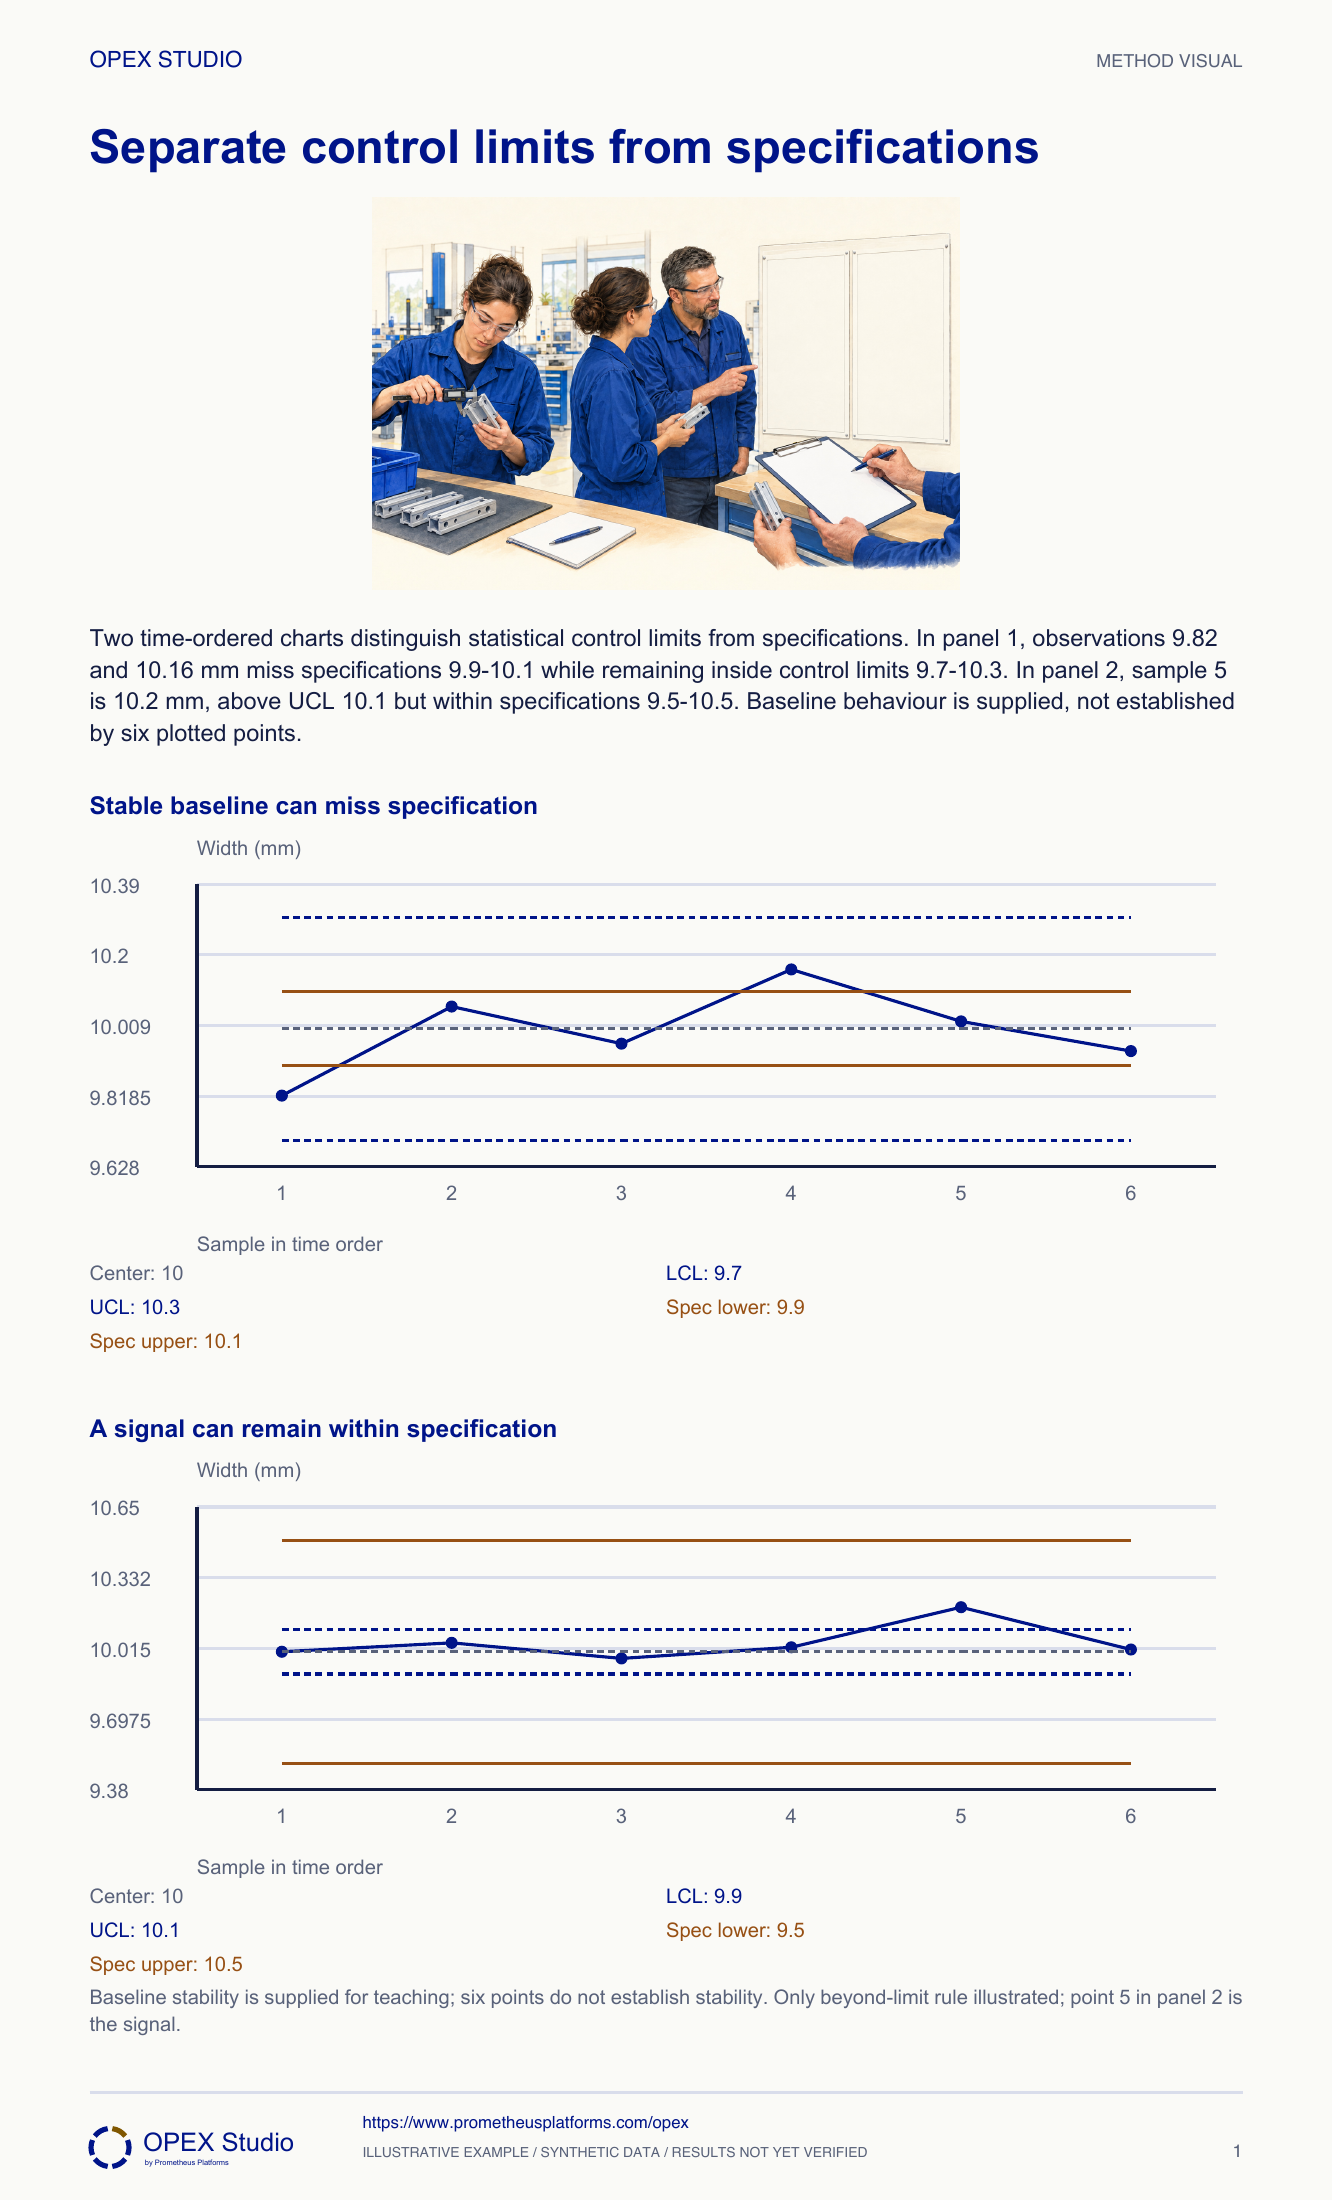
Control limits describe expected process behaviour under a specified baseline model. Specifications express an engineering or customer requirement. They answer different questions and must be labelled differently. A process can behave consistently yet produce unacceptable output because its ordinary variation is too wide or its centre is misplaced. Conversely, a point can be within specification and still signal an unusual process change. Investigate that signal through the approved response instead of accepting it simply because the product passed. Improve the system for common-cause loss; do not continually adjust settings to chase ordinary noise. Stability must be assessed from suitable evidence, not a handful of decorative points.
Panel 1 control limits 9.7–10.3; specifications 9.9–10.1 mm.
Panel 2 point 10.2 exceeds UCL10.1 while within specifications9.5–10.5.
Supplied baseline stability; six plotted points are not a stability study.
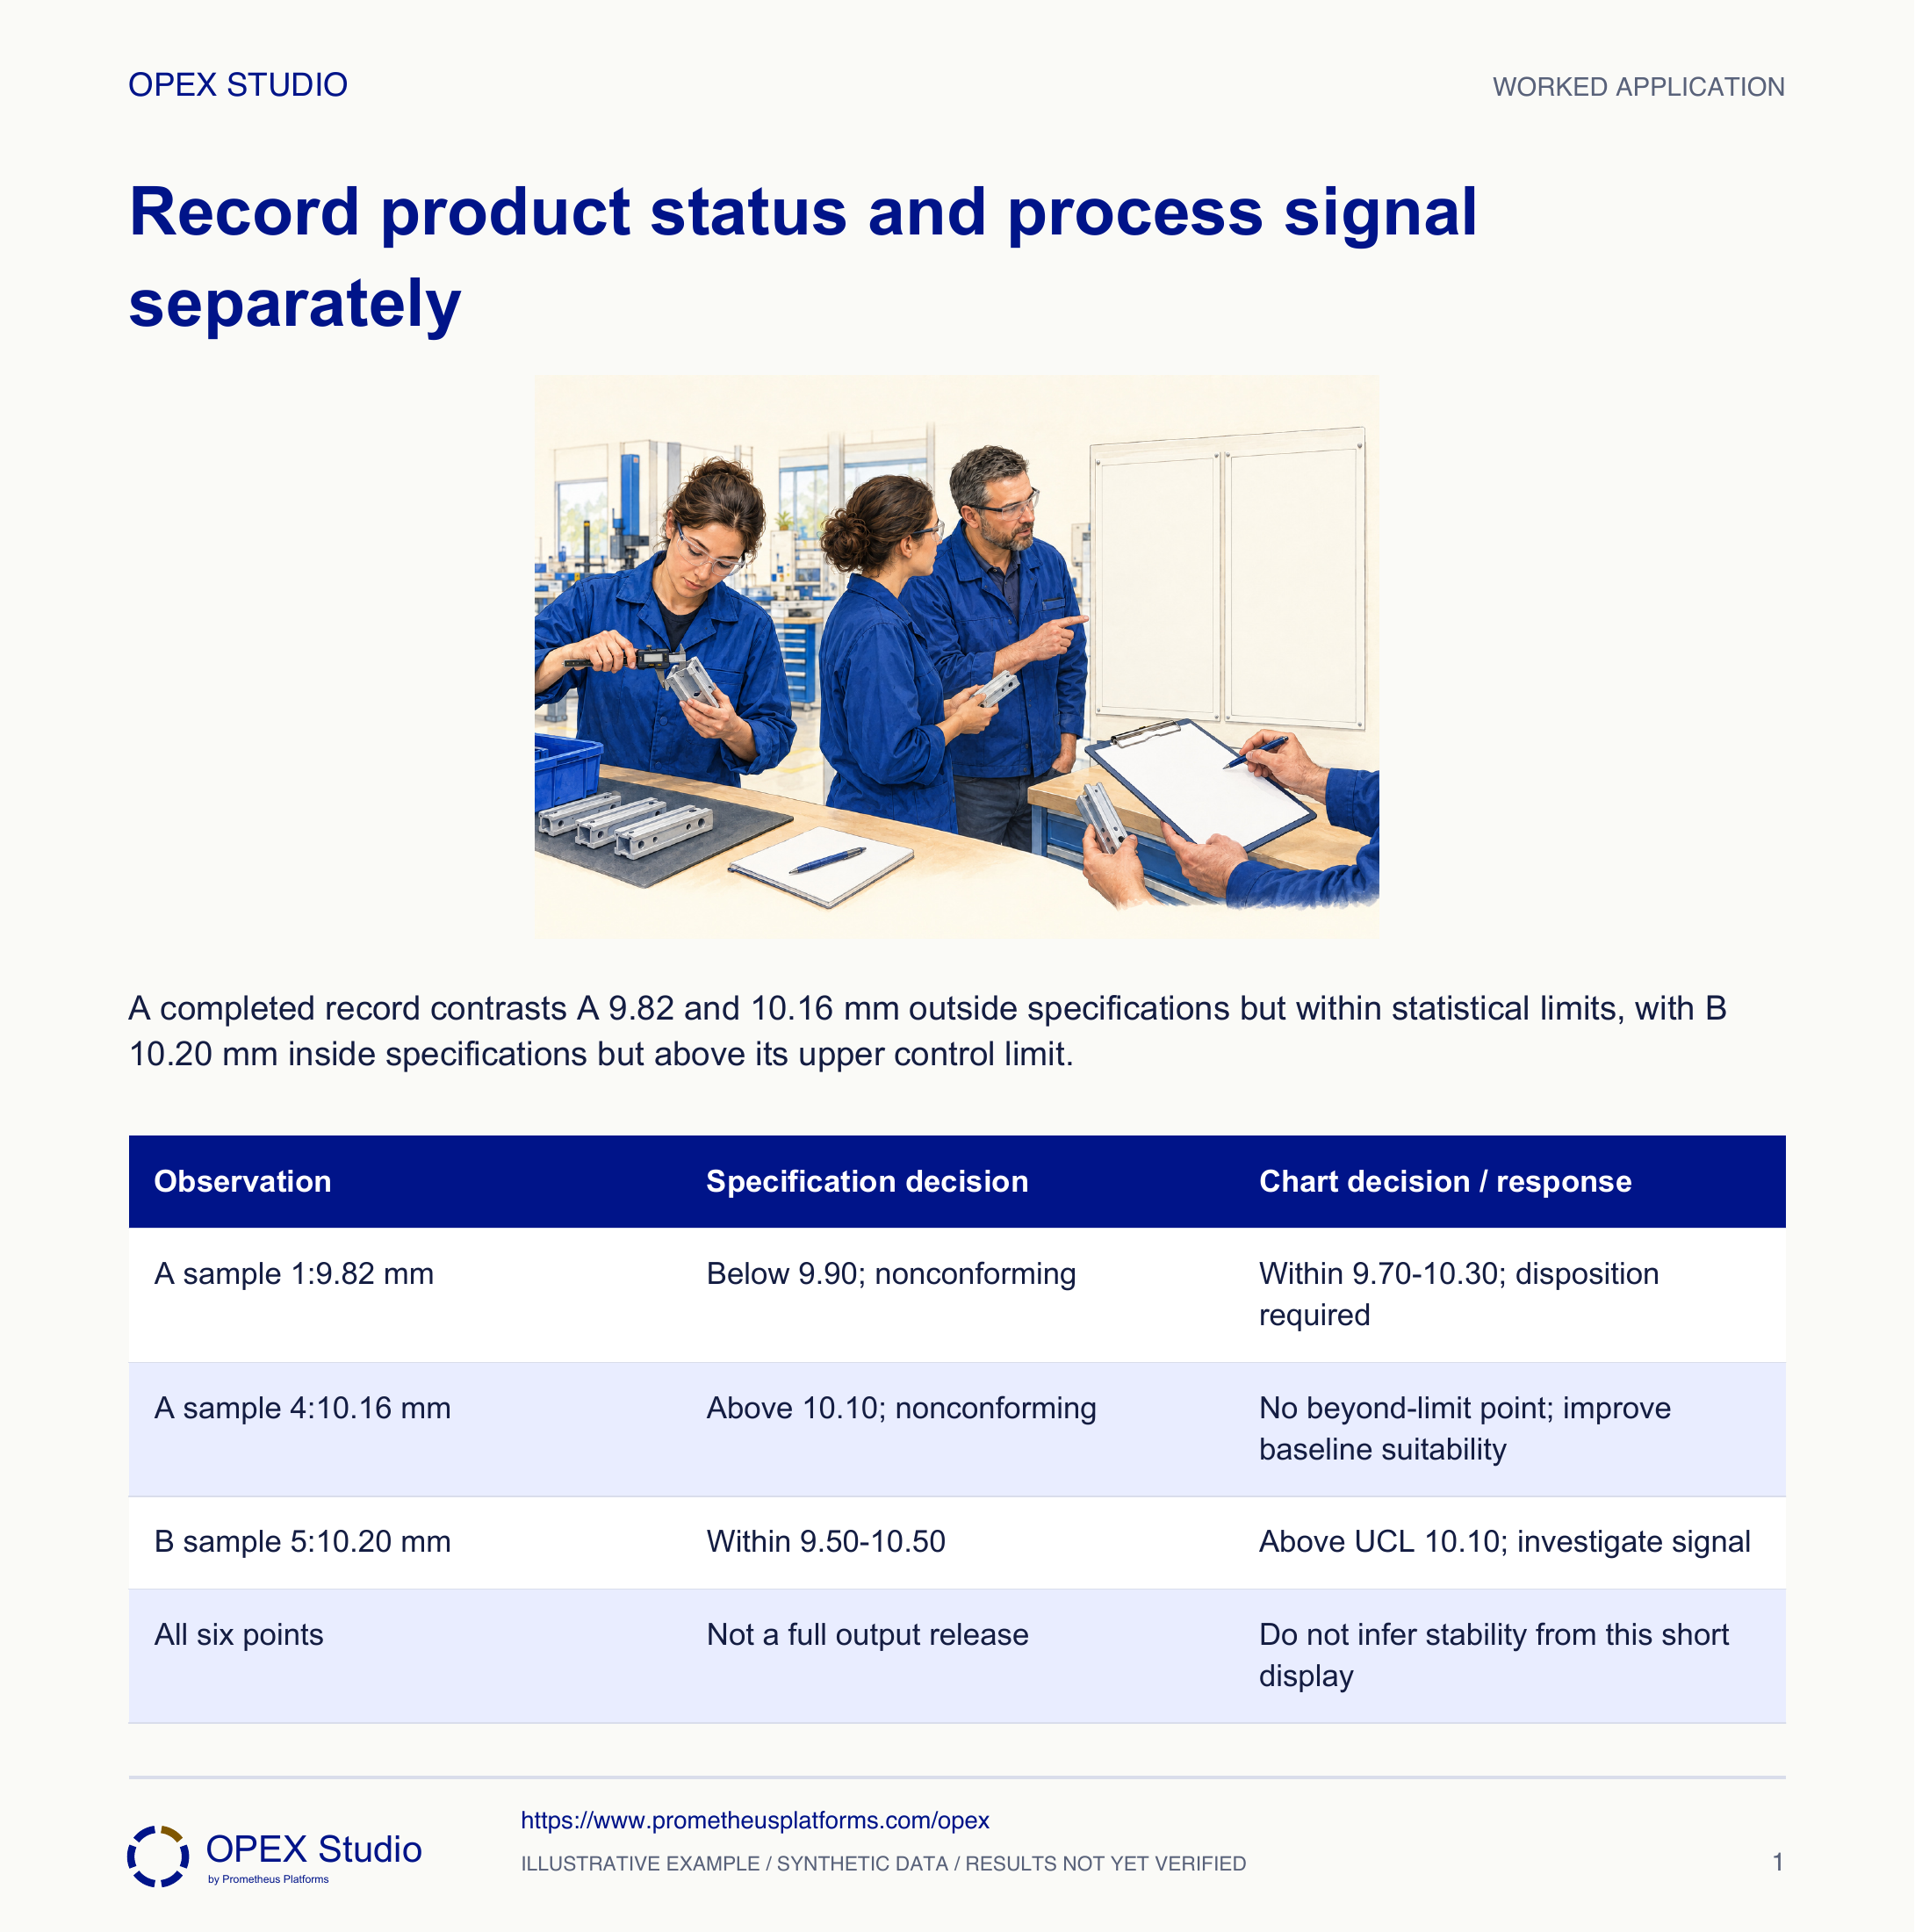
Fictional training case: quality technician Sam reviews width measurements from two different processes. The baseline center and statistical limits are supplied and approved for this exercise; the six displayed values are recent observations, not the data used to calculate those limits. Engineering specifications describe each product requirement.
Keep the observation and prior signal comparison visible, but mark interpretation provisional and escalate baseline suitability. Continue the applicable product controls; do not create new limits from six points.
A control limit is meaningful only for the process and statistic it represents. A baseline problem is not resolved by substituting specification limits.
Classify product conformance and a process signal separately, record the appropriate response, and explain what the supplied chart cannot establish.
Fictional training case: quality technician Sam reviews width measurements from two different processes. The baseline center and statistical limits are supplied and approved for this exercise; the six displayed values are recent observations, not the data used to calculate those limits. Engineering specifications describe each product requirement.
Role: Quality technician working with the process owner under a defined reaction plan.
The measurement, units, relevant process and chart baseline are identified before interpretation. Product acceptance is assessed against specifications; process behavior is assessed against the chart rules.
A colleague labels every in-specification observation green and proposes ignoring process B sample 5 because it still meets the drawing.
| Reference | Process A: width in mm | Process B: width in mm |
|---|---|---|
| Baseline center | 10.00 | 10.00 |
| Control limits | 9.70 to 10.30 | 9.90 to 10.10 |
| Specifications | 9.90 to 10.10 | 9.50 to 10.50 |
| Samples 1–3 | 9.82; 10.06; 9.96 | 10.00; 10.04; 9.97 |
| Samples 4–6 | 10.16; 10.02; 9.94 | 10.02; 10.20; 10.01 |
Sam labels the statistical limits as the supplied process baseline and the specifications as the fictional engineering acceptance range. He keeps units and process identity on both charts.
Why: Calling both sets tolerances hides the decision being made. The source of a line determines what crossing it means.
Evidence: Process A has narrower specifications than statistical limits; process B has wider specifications.
For A, he marks sample 1 at 9.82 and sample 4 at 10.16 as outside 9.90–10.10. For B, every displayed individual observation lies within 9.50–10.50.
Why: This is a conformance comparison for the displayed values, not blanket release of all output or a claim that a process is capable.
Evidence: A has two displayed nonconforming observations; B has none by the stated width limits.
He compares each point with its own process control limits. A has no beyond-limit point. B sample 5 at 10.20 exceeds its 10.10 upper control limit by 0.10 mm.
Why: A process signal can occur while the measured part meets specification. Conversely, a statistically predictable process can produce unacceptable output.
Evidence: Record B sample 5 as a signal; do not redraw the baseline to include it.
Sam routes A nonconforming output through disposition and asks the process owner to address the supplied stable but unsuitable baseline. For B he initiates the approved signal investigation and exposure assessment.
Why: Repeated adjustment after every ordinary fluctuation is different from investigating a signal. Neither route is replaced by a green product label.
Evidence: Two records: product disposition and process response, each with an owner and evidence requirement.
He notes that six displayed points cannot establish stability or estimate capability reliably. The example does not calculate control limits or capability indices.
Why: Correct classification should not become an unsupported statement about long-term performance.
Evidence: The final decision cites supplied baseline assumptions and asks for suitable history if those assumptions are uncertain.
| Observation | Specification decision | Chart decision / response |
|---|---|---|
| A sample 1:9.82 mm | Below 9.90; nonconforming | Within 9.70–10.30; disposition required |
| A sample 4:10.16 mm | Above 10.10; nonconforming | No beyond-limit point; improve baseline suitability |
| B sample 5:10.20 mm | Within 9.50–10.50 | Above UCL 10.10; investigate signal |
| All six points | Not a full output release | Do not infer stability from this short display |
Sam learns that process B changed tooling before sample 1, and the owner has not confirmed whether the supplied baseline remains applicable.
Keep the observation and prior signal comparison visible, but mark interpretation provisional and escalate baseline suitability. Continue the applicable product controls; do not create new limits from six points.
A control limit is meaningful only for the process and statistic it represents. A baseline problem is not resolved by substituting specification limits.
Tool-change time, approved chart definition, measurement record and suitable process history are required.
New fictional process C measures length. Its approved baseline has center 20.00 mm and limits 19.80–20.20 mm. Specifications are 19.90–20.10 mm. The exercise again uses only the beyond-limit rule and supplies baseline validity.
| Time-order observation | Length |
|---|---|
| 1 | 20.05 mm |
| 2 | 20.15 mm |
| 3 | 20.25 mm |
| 4 | 19.95 mm |
Observations 1 and 4 meet specifications and do not cross a control limit. Observation 2 exceeds USL 20.10 by 0.05 mm but remains inside UCL 20.20. Observation 3 exceeds both USL and UCL.
Both 2 and 3 need product disposition under the applicable plan. Observation 3 additionally supplies the illustrated process signal; observation 2 alone does not.
The four points cannot establish stability, capability or the complete containment boundary. Other pattern rules and process context may alter the broader response.
| Observation / mm | Specification status | Beyond-limit decision |
|---|---|---|
| 1:20.05 | In specification | No beyond-limit signal |
| 2:20.15 | Nonconforming | No beyond-limit signal |
| 3:20.25 | Nonconforming | Beyond UCL; process investigation |
| 4:19.95 | In specification | No beyond-limit signal |
Who or what established each line?
What does B sample 5 require despite meeting specification?
How does observation 2 differ from 3?
What if these limits came from another setup?
Complete the two classifications in separate columns before writing any response; then compare each with the answer.
Owner: Process owner with quality engineering
Record: Chart event and product-disposition references
Review: At the signal response and subsequent approved verification
Evidence: Correct chart identity, baseline, measurement context, affected-output assessment and disposition authority
Retain the signal/hold records and escalate the uncertainty; obtain suitable evidence before revising limits or declaring performance.
Control charts follow a statistic in time, using limits derived from a reference process; nonrandom patterns can matter even within limits.
Public primary-source summary; underlying paid standards/forms are not reproduced.Statistical stability does not imply acceptable output; reducing common-cause variation requires process improvement.
Public primary-source summary; underlying paid standards/forms are not reproduced.Read the lessons online or use these PDFs to prepare, practise and review with your team. No sign-in needed.
Case objectives, demonstration plans, debriefs, common mistakes and application checks across all 81 workplace cases and method lessons.
Download Facilitator guide PDF · 166 pages · 65.1 MBPrintable case worksheets, blank observation records and five calculation exercises; answers are separate.
Download Learner workbook PDF · 169 pages · 10.7 MBReasoned sample responses, worked calculations and coaching guidance; fictional examples are clearly labelled.
Download Answer key and coaching notes PDF · 105 pages · 8.5 MBThe native method mechanisms and worked applications for all 68 detailed lessons, in a separate bookmarked portrait reference.
Download Method and application reference PDF · 141 pages · 10.2 MBFive illustrated system chapters: 15 Flare concept maps and 26 original workplace teaching cards, with links to all 81 supporting cases and method lessons.
Download Illustrated systems atlas PDF · 69 pages · 55.8 MBExplore this connected method and its separate application conditions.
Explore the connected method →Explore this connected method and its separate application conditions.
Explore the connected method →Explore this connected method and its separate application conditions.
Explore the connected method →