Facilitator guide
Case objectives, demonstration plans, debriefs, common mistakes and application checks across all 81 workplace cases and method lessons.
Download Facilitator guide PDF · 166 pages · 65.1 MB OPEXSTUDIO
Select representative parts, appraisers and conditions.. Follow the visual, practise a decision, then check your thinking.
Fictional teaching examples and AI-generated illustrations. Proposed changes and goals are not achieved results. Use the written instructions and check local conditions before applying a method.
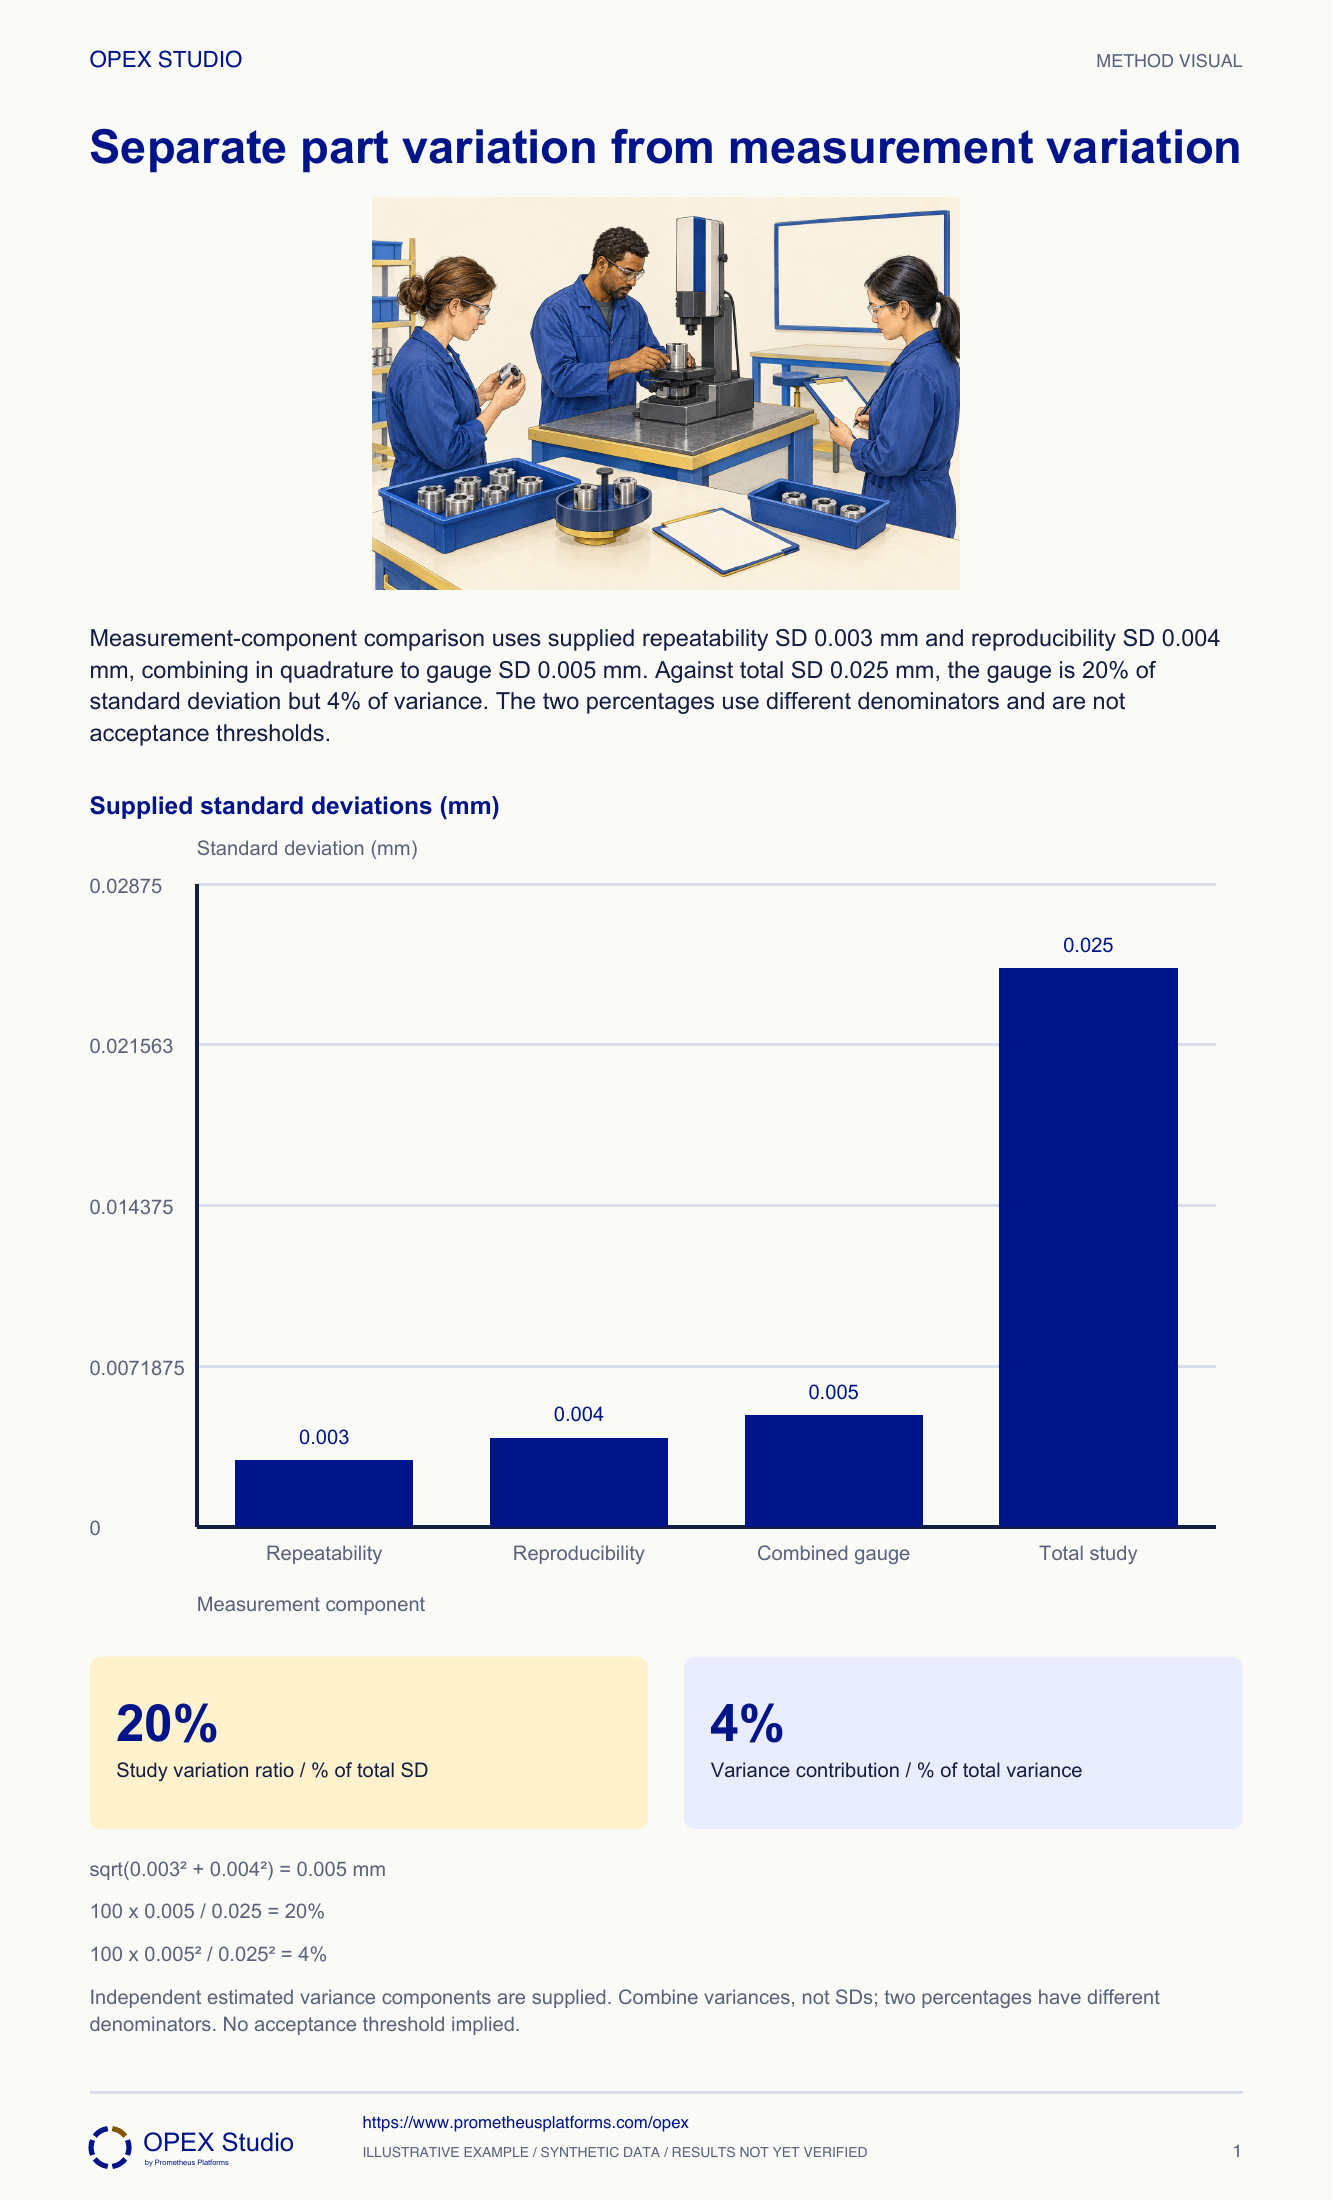
A measurement study separates variation due to the measurement system from variation between parts. Select parts and conditions that represent the intended use, and use a design appropriate to whether repeated measurements are possible. Randomized, blinded repeats reduce memory and order effects. Repeatability and reproducibility are distinct components; estimated independent variances combine before taking a square root. Consequently, a percentage based on standard deviations is not the same as a percentage of variance. Do not treat a sample design or a generic percentage as a universal acceptance criterion. Interpret the result against the measurement decision, risk, resolution and other relevant sources of measurement error.
10parts×3operators×2repeats=60 illustrative readings.
sqrt(0.003²+0.004²)=0.005 mm gauge SD.
0.005/0.025=20% SD ratio; squared ratio=4% variance contribution.
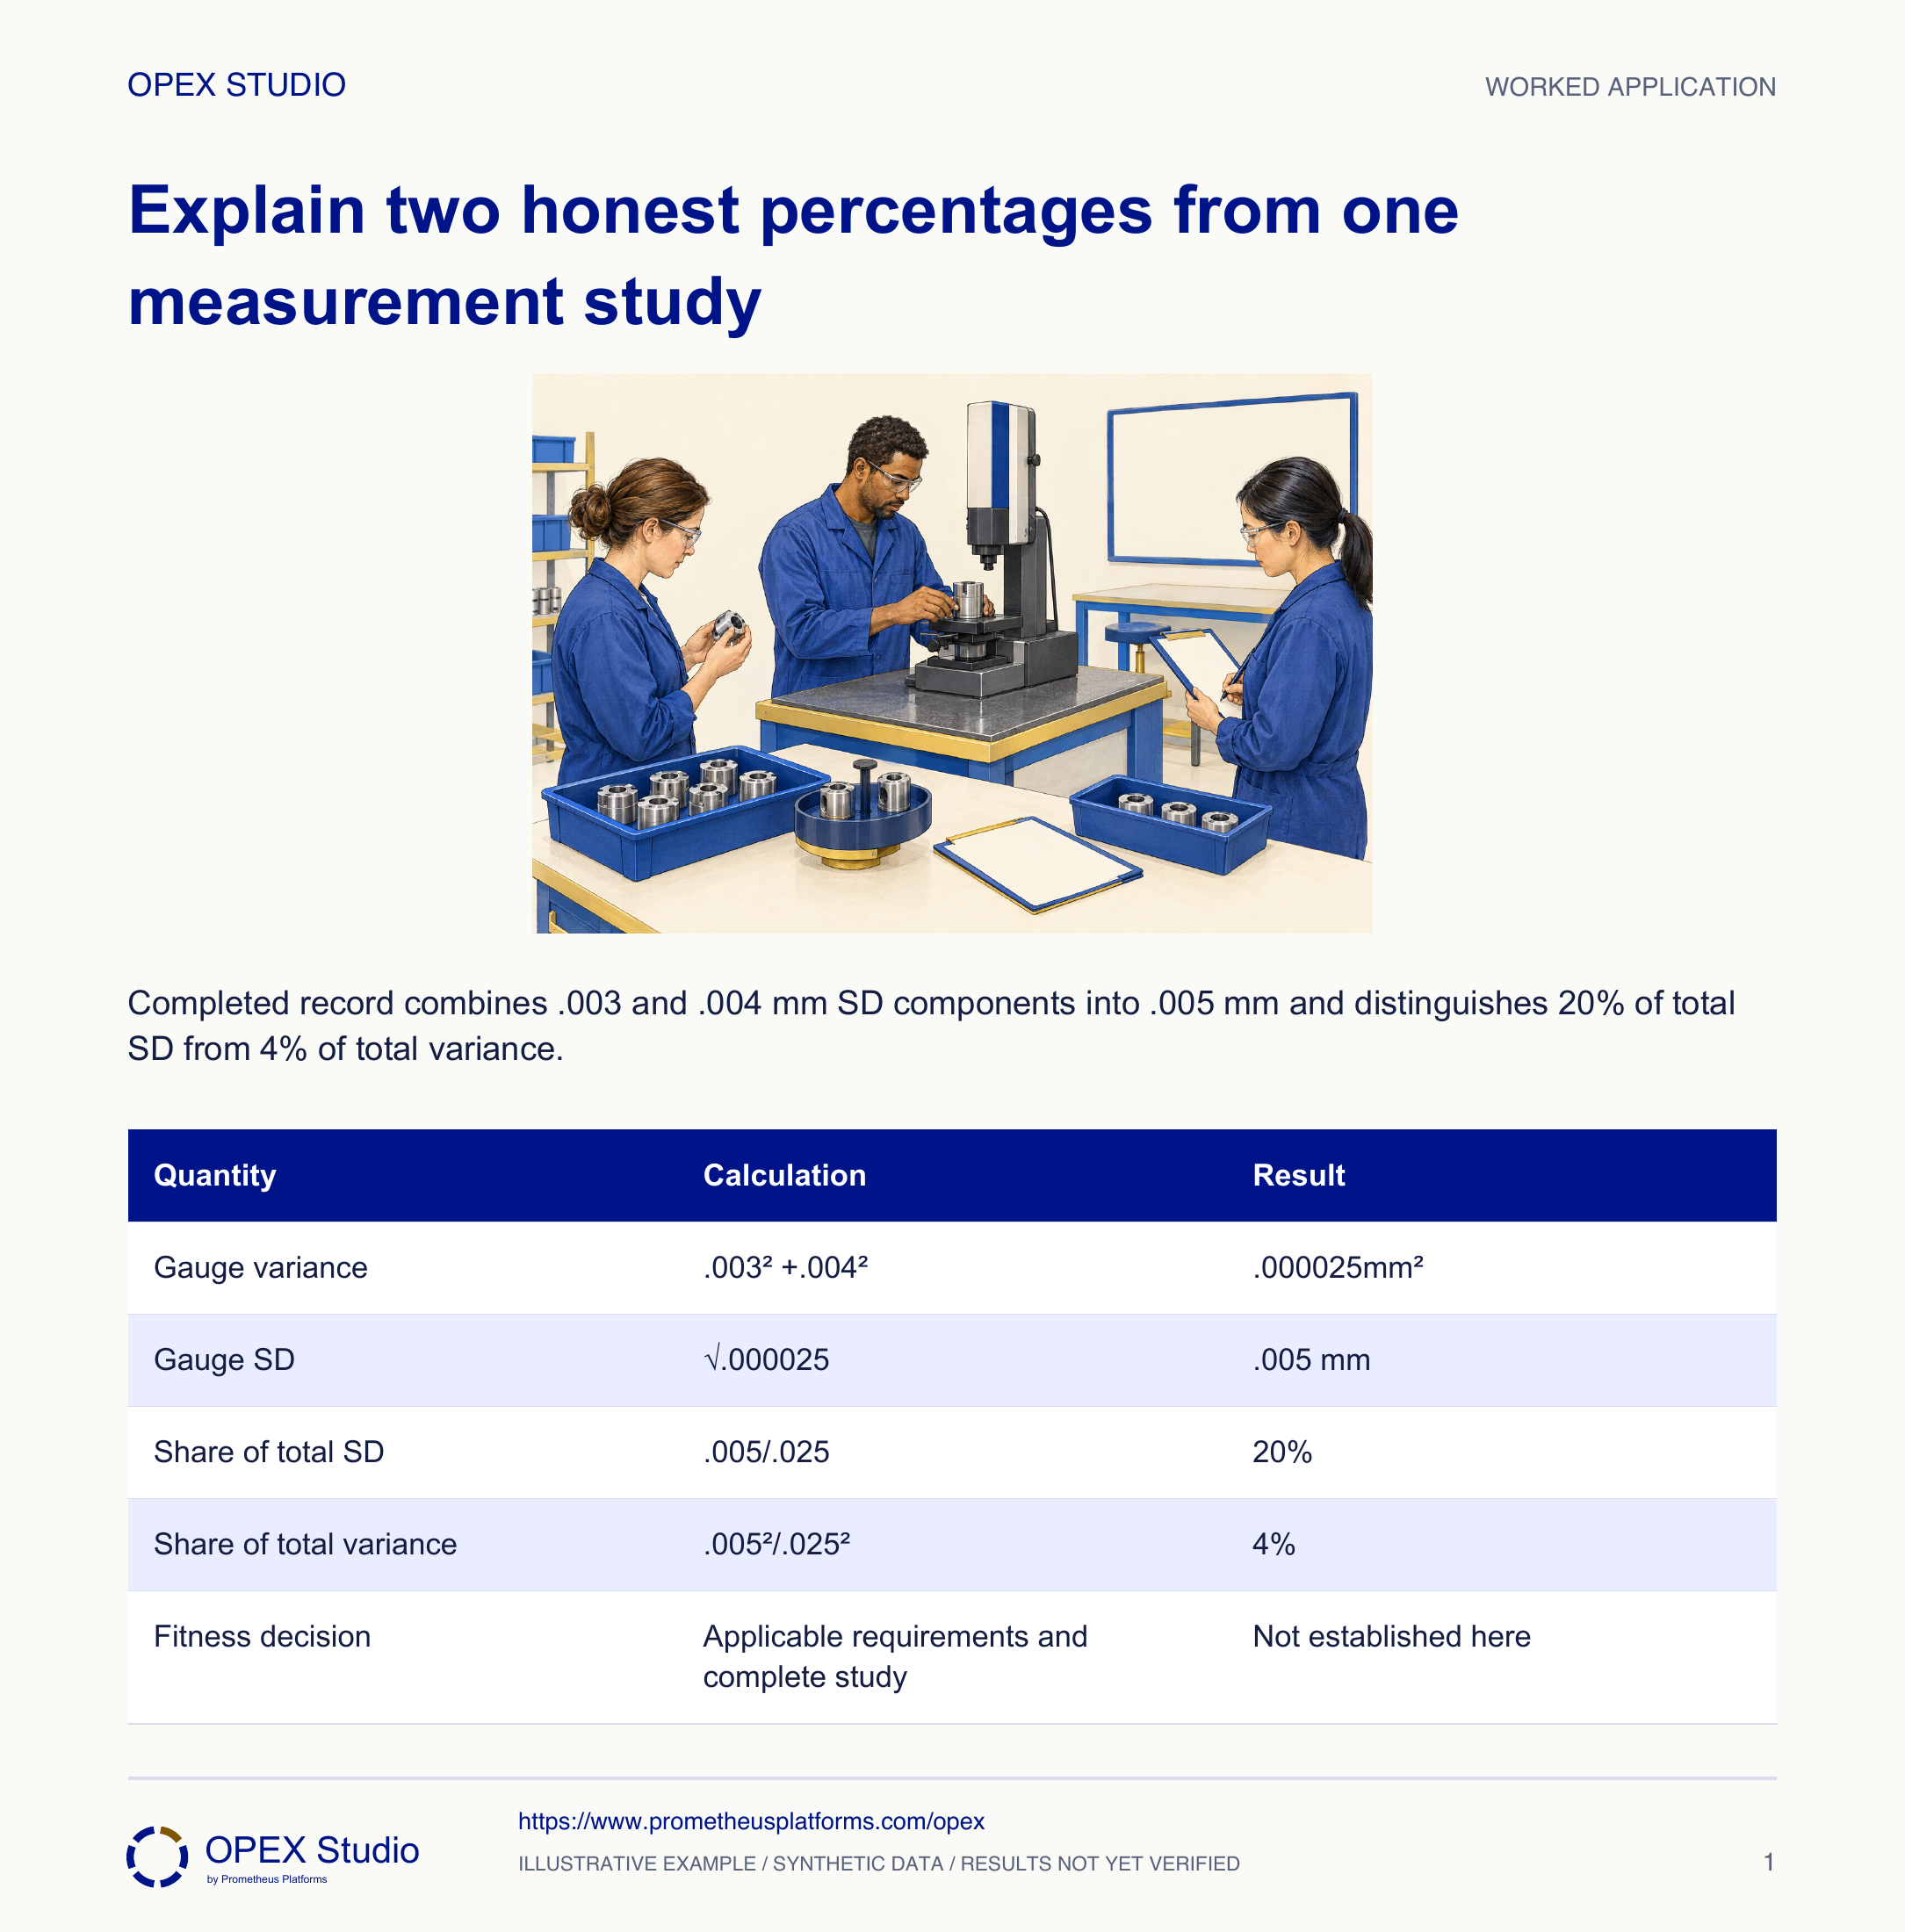
Fictional case: a gauge study uses ten representative parts, three operators and two repeated measurements, giving 60 readings. The core exhibit supplies repeatability SD .003 mm, reproducibility SD .004 mm and total study SD .025 mm. Metrologist Eve must explain a report that labels gauge variation both 20% and 4%, without claiming these components were calculated from an unseen raw dataset.
Review and redesign the representative-artifact selection before interpreting the ratio as evidence for normal production decisions. Preserve the original study scope.
The denominator and apparent relative variation depend on the study population. A ratio from an artificially narrow range can be misleading for the intended use.
Distinguish measurement-study design from supplied variance estimates and explain why standard-deviation and variance percentages differ.
Fictional case: a gauge study uses ten representative parts, three operators and two repeated measurements, giving 60 readings. The core exhibit supplies repeatability SD .003 mm, reproducibility SD .004 mm and total study SD .025 mm. Metrologist Eve must explain a report that labels gauge variation both 20% and 4%, without claiming these components were calculated from an unseen raw dataset.
Role: Measurement-system specialist and inspection owner
The study represents intended parts, appraisers and conditions; repeats preserve identity and avoid memory effects; the analysis method and denominator are explicit.
A manager adds .003 and .004 to obtain .007 mm and treats the larger percentage as evidence that the smaller one is dishonest.
| Study item | Supplied value |
|---|---|
| Design | 10 parts ×3 operators ×2 repeats =60 readings |
| Repeatability SD | .003 mm |
| Reproducibility SD | .004 mm |
| Total study SD | .025 mm |
| Raw readings / fitted model | Not supplied in this calculation exercise |
Eve records the characteristic, range of intended parts, fixture, gauge and appraisers. She asks whether the study represents actual use rather than ten unusually similar parts selected for convenience.
Why: A precise calculation cannot repair an unrepresentative study. Measurement fitness concerns the decisions the system must support.
Evidence: The study plan identifies artifacts, operators, conditions and intended use.
The illustrative plan has 60 measurement opportunities. Eve assigns stable part identities and a blinded/randomized order where suitable, with actual observations recorded rather than copied from earlier rounds.
Why: Repeats are meant to reveal measurement variation, not recall of the previous reading. The design is an example, not a mandated sample size for every measurement system.
Evidence: A measurement schedule distinguishes part, operator and repeat.
She squares the SDs, adds .000009 and .000016mm², then takes the square root:.005 mm. She does not add standard deviations directly.
Why: Independent component variances add under the stated model. Their square root returns the result to measurement units.
Evidence: Combined gauge variance .000025mm² and SD .005 mm.
Gauge SD divided by total SD is .005/.025=.20 or 20%. Gauge variance divided by total variance is .000025/.000625=.04 or 4%.
Why: The two percentages answer different questions and are mathematically consistent. A common study-variation multiplier cancels when applied to both numerator and denominator.
Evidence: The report labels percent of total SD separately from percent of total variance.
Eve requests the fitted-model details, representative data and applicable decision criteria. She also considers bias, resolution, stability and other measurement effects beyond repeatability/reproducibility.
Why: A small variance ratio alone does not establish every aspect of measurement fitness. Calibration status and repeatability are related evidence, not interchangeable approvals.
Evidence: The conclusion reports the supplied arithmetic and lists the remaining fitness evidence.
| Quantity | Calculation | Result |
|---|---|---|
| Gauge variance | .003² +.004² | .000025mm² |
| Gauge SD | √.000025 | .005 mm |
| Share of total SD | .005/.025 | 20% |
| Share of total variance | .005²/.025² | 4% |
| Fitness decision | Applicable requirements and complete study | Not established here |
The ten study parts were all chosen from one narrow group, unlike the range encountered in normal inspection.
Review and redesign the representative-artifact selection before interpreting the ratio as evidence for normal production decisions. Preserve the original study scope.
The denominator and apparent relative variation depend on the study population. A ratio from an artificially narrow range can be misleading for the intended use.
The revised plan explains how selected artifacts represent the measurement task.
New supplied estimates are repeatability SD .006 mm, reproducibility SD .008 mm and total SD .050 mm. A trainee reports combined SD .014 mm.
| Component | Supplied SD |
|---|---|
| Repeatability | .006 mm |
| Reproducibility | .008 mm |
| Total | .050 mm |
Gauge variance=.000036+.000064=.000100mm², so SD=.010 mm. The SD share is .010/.050=20%; variance share is .0001/.0025=4%.
The .014 result incorrectly adds SDs. Representative parts/appraisers and a suitable analysis model still need evidence, as do relevant bias, resolution, stability or decision criteria.
| Metric | Result | Unit or denominator |
|---|---|---|
| Combined gauge SD | .010 | mm |
| SD share | 20% | Total SD |
| Variance share | 4% | Total variance |
How would memory of a reading bias the exercise?
Why square before adding?
How can 20% and 4% agree?
What can this ratio not tell us?
Draw a units column beside every intermediate calculation.
Owner: Measurement-system owner
Record: Study plan, raw readings, model, component labels and fitness decision
Review: Before use for a new decision and after material method changes
Evidence: Representative design and suitable measurement evidence
Improve the method or study design and reassess rather than changing percentage labels to appear acceptable.
Measurement characterization covers repeatability, reproducibility, stability, bias, resolution, linearity and other error sources.
Public primary-source summary; underlying paid standards/forms are not reproduced.A measurement study needs considered choices of artifacts, operators, gauges and measurement levels.
Public primary-source summary; underlying paid standards/forms are not reproduced.Read the lessons online or use these PDFs to prepare, practise and review with your team. No sign-in needed.
Case objectives, demonstration plans, debriefs, common mistakes and application checks across all 81 workplace cases and method lessons.
Download Facilitator guide PDF · 166 pages · 65.1 MBPrintable case worksheets, blank observation records and five calculation exercises; answers are separate.
Download Learner workbook PDF · 169 pages · 10.7 MBReasoned sample responses, worked calculations and coaching guidance; fictional examples are clearly labelled.
Download Answer key and coaching notes PDF · 105 pages · 8.5 MBThe native method mechanisms and worked applications for all 68 detailed lessons, in a separate bookmarked portrait reference.
Download Method and application reference PDF · 141 pages · 10.2 MBFive illustrated system chapters: 15 Flare concept maps and 26 original workplace teaching cards, with links to all 81 supporting cases and method lessons.
Download Illustrated systems atlas PDF · 69 pages · 55.8 MBExplore this connected method and its separate application conditions.
Explore the connected method →Explore this connected method and its separate application conditions.
Explore the connected method →Explore this connected method and its separate application conditions.
Explore the connected method →