Facilitator guide
Case objectives, demonstration plans, debriefs, common mistakes and application checks across all 81 workplace cases and method lessons.
Download Facilitator guide PDF · 166 pages · 65.1 MB OPEXSTUDIO
Define one observable effect and scope.. Follow the visual, practise a decision, then check your thinking.
Fictional teaching examples and AI-generated illustrations. Proposed changes and goals are not achieved results. Use the written instructions and check local conditions before applying a method.
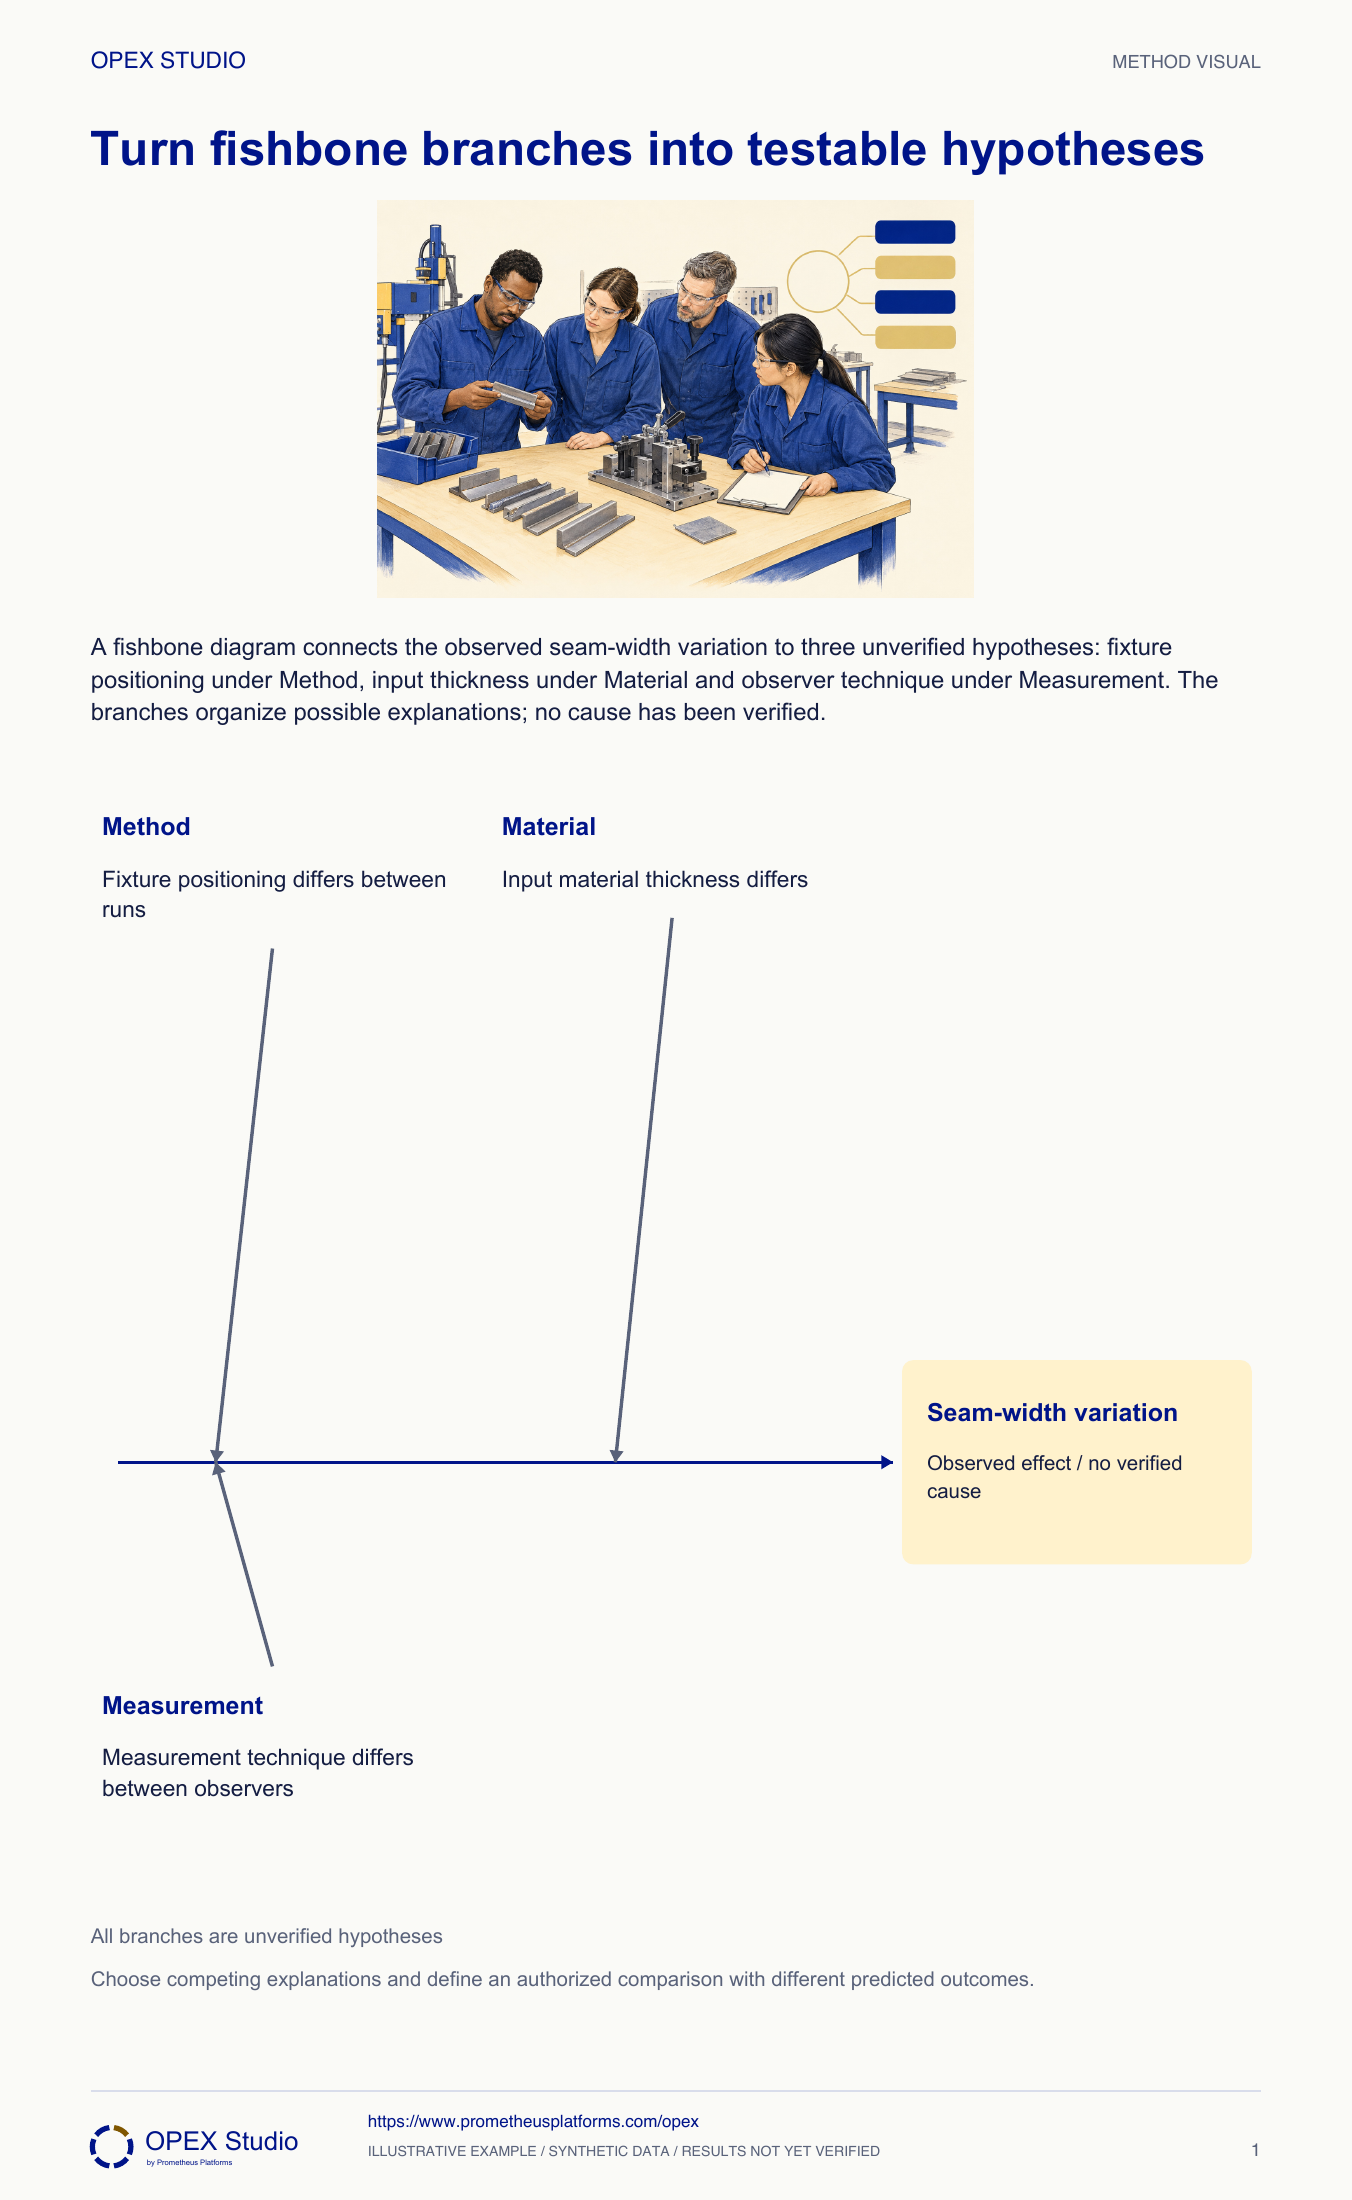
The branches of a fishbone are hypotheses. Begin with one observable effect and a useful scope, then invite several explanations without promoting consensus into proof. Categories help organize discussion; they do not require every branch to be filled or make the resulting list exhaustive. Select important hypotheses and state an observation or test that could distinguish each from an alternative. Mark evidence as observed fact, hypothesis, test result or supported cause. When a test contradicts a branch, update the picture rather than defending the original workshop. A causal conclusion should explain the evidence and survive a relevant verification.
Three hypotheses initially mean zero verified causes.
Use fact, hypothesis, test result and supported cause as distinct labels.
A category heading is not evidence.
Fictional case: seam-width variation at Cedar Fabrication prompts three suggestions: fixture positioning differs, observers measure differently, or material thickness changes. The core fishbone preserves these three hypotheses and zero verified causes. Facilitator Elena must turn the discussion into a useful test plan without allowing agreement to become proof.
Record the result as inconclusive for the intended hypothesis and repair the test method before attributing the effect to operators.
The comparison changed more than the intended factor. An ambiguous test cannot fairly support a specific blame or corrective action.
Convert a list of possible causes into competing, testable explanations with explicit evidence states.
Fictional case: seam-width variation at Cedar Fabrication prompts three suggestions: fixture positioning differs, observers measure differently, or material thickness changes. The core fishbone preserves these three hypotheses and zero verified causes. Facilitator Elena must turn the discussion into a useful test plan without allowing agreement to become proof.
Role: Improvement facilitator with measurement and process specialists
The effect has a defined scope; observations and hypotheses use different labels; a proposed test predicts what would differ under competing explanations.
The team votes fixture positioning as the root cause because it is the most familiar explanation. No comparison or corroborating record has been supplied.
| Evidence item | Current status |
|---|---|
| Effect | Seam-width variation observed; quantify scope before testing |
| Fixture positioning | Hypothesis |
| Observer technique | Competing measurement hypothesis |
| Material thickness | Competing input hypothesis |
| Verified causes | Zero initially |
Elena writes the seam-width condition, affected product/period and measurement method. She avoids “variation caused by poor setup”, which embeds the desired conclusion in the problem statement.
Why: A neutral effect allows rival explanations to be evaluated. An imprecise effect makes nearly any story appear to fit.
Evidence: A bounded effect statement separates what was observed from why it may have happened.
The group records the three suggestions as hypotheses and notes who can supply relevant evidence. Category labels such as method, measurement and material organize thinking but do not add proof.
Why: The fishbone is a hypothesis organizer. The number of people agreeing with a branch is not evidence of the causal mechanism.
Evidence: Every branch is labelled unverified; no “confirmed” color or check mark appears.
For the measurement hypothesis, Elena asks qualified observers to measure the same retained seam samples under a defined method with identity concealed as appropriate. In parallel she preserves fixture and material records.
Why: If observers disagree on the same physical sample, measurement variation deserves attention. If agreement is adequate for the task, that result weakens this particular explanation but does not prove the fixture branch.
Evidence: The plan states rival predictions, sample identity, method and authorized owner.
Before results exist, the team writes that a fixture explanation would be weakened if comparable seam variation persists under verified identical positioning and measurement conditions. It identifies uncontrolled factors that could still confound the comparison.
Why: Predictions written in advance reduce the temptation to reinterpret every outcome as support. A failed prediction is useful learning, not a reason to delete a row.
Evidence: The test card contains both supporting and contradicting outcomes.
Elena leaves outcomes blank until observations are made. After a reviewed test, the group can label the evidence as supporting, contradicting or inconclusive and decide the next action.
Why: A planned test is not a completed test. Correction or trial action must follow the evidence and relevant authority rather than the appeal of a completed-looking fishbone.
Evidence: The record includes result, limitations, decision and next owner without invented observations.
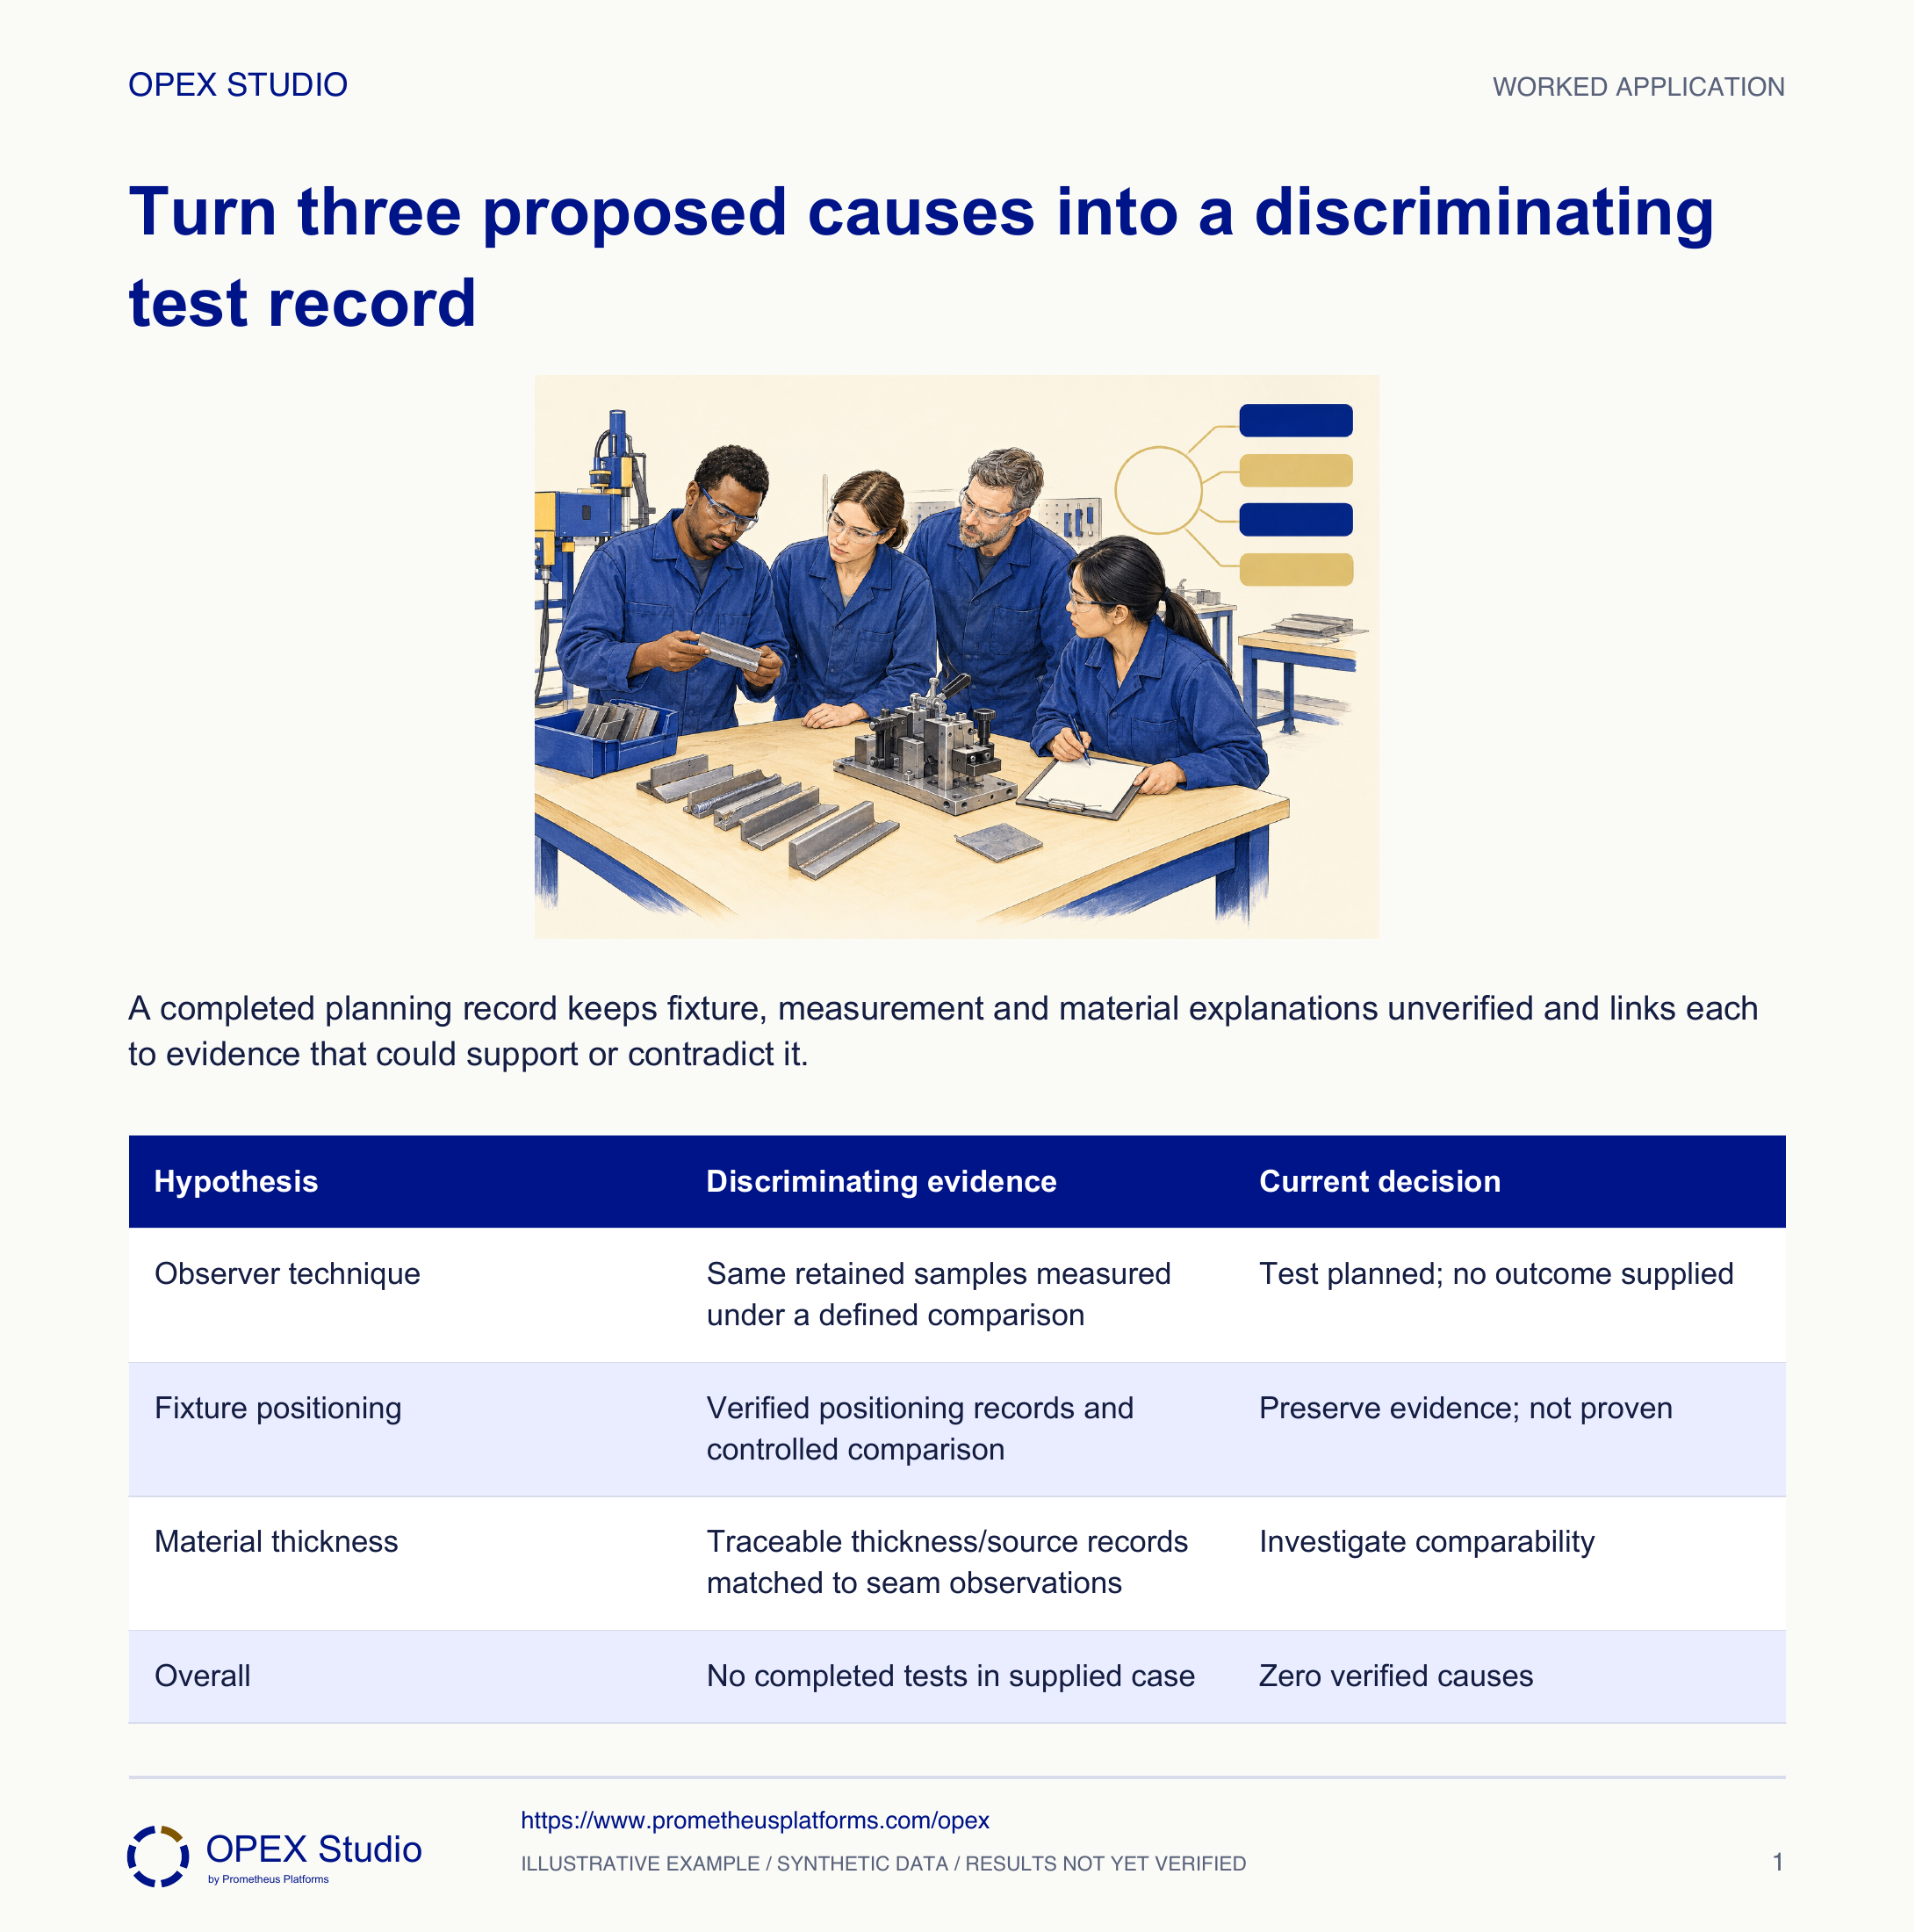
| Hypothesis | Discriminating evidence | Current decision |
|---|---|---|
| Observer technique | Same retained samples measured under a defined comparison | Test planned; no outcome supplied |
| Fixture positioning | Verified positioning records and controlled comparison | Preserve evidence; not proven |
| Material thickness | Traceable thickness/source records matched to seam observations | Investigate comparability |
| Overall | No completed tests in supplied case | Zero verified causes |
Observers disagree, but the comparison used different sample locations and unclear measurement instructions.
Record the result as inconclusive for the intended hypothesis and repair the test method before attributing the effect to operators.
The comparison changed more than the intended factor. An ambiguous test cannot fairly support a specific blame or corrective action.
The next plan identifies the same measurand, location and procedure.
New fictional issue: labels are missing from some cartons. The team proposes an empty label reel or a scanner that fails to detect missing labels. Supplied facts are a reel-change timestamp and three retained carton IDs; no test has been run.
| Item | Supplied fact |
|---|---|
| Reel change | Recorded at 14:20 |
| Cartons | Three retained IDs; exact times to retrieve |
| Scanner test | Not performed |
An empty reel could explain label absence; missed detection could explain escape. Either or both may be relevant, but neither is verified by this record.
Match carton timing to reel status and inspect the authorized application record. Separately use the approved detection challenge procedure with controlled test pieces; define what a successful or failed challenge would show without releasing test pieces as product.
| Branch | Question | State |
|---|---|---|
| Occurrence | Was label supply/application absent at the affected time? | Unverified |
| Escape | Could the approved detection check find the missing condition? | Unverified |
| Total verified causes | No completed discriminating evidence | 0 |
Does the statement already blame something?
What result would weaken the favorite?
Can the carton become wrong and then escape for different reasons?
When is inconclusive the correct answer?
Write two rival predictions and leave results blank until evidence is supplied.
Owner: Investigation owner with process and measurement specialists
Record: Hypothesis, prediction, test result and decision log
Review: After each completed comparison
Evidence: Traceable observations and a bounded inference, including contrary evidence
Revise the test or investigate another branch; do not rename an inconclusive result as proof.
Organize possible causes of a defined effect for investigation; the diagram structures ideas rather than proving them.
Public primary-source summary; underlying paid standards/forms are not reproduced.Read the lessons online or use these PDFs to prepare, practise and review with your team. No sign-in needed.
Case objectives, demonstration plans, debriefs, common mistakes and application checks across all 81 workplace cases and method lessons.
Download Facilitator guide PDF · 166 pages · 65.1 MBPrintable case worksheets, blank observation records and five calculation exercises; answers are separate.
Download Learner workbook PDF · 169 pages · 10.7 MBReasoned sample responses, worked calculations and coaching guidance; fictional examples are clearly labelled.
Download Answer key and coaching notes PDF · 105 pages · 8.5 MBThe native method mechanisms and worked applications for all 68 detailed lessons, in a separate bookmarked portrait reference.
Download Method and application reference PDF · 141 pages · 10.2 MBFive illustrated system chapters: 15 Flare concept maps and 26 original workplace teaching cards, with links to all 81 supporting cases and method lessons.
Download Illustrated systems atlas PDF · 69 pages · 55.8 MBExplore this connected method and its separate application conditions.
Explore the connected method →Explore this connected method and its separate application conditions.
Explore the connected method →Explore this connected method and its separate application conditions.
Explore the connected method →Explore this connected method and its separate application conditions.
Explore the connected method →Explore this connected method and its separate application conditions.
Explore the connected method →