Facilitator guide
Case objectives, demonstration plans, debriefs, common mistakes and application checks across all 81 workplace cases and method lessons.
Download Facilitator guide PDF · 166 pages · 65.1 MB OPEXSTUDIO
Declare planned production time. Follow the visual, practise a decision, then check your thinking.
Fictional teaching examples and AI-generated illustrations. Proposed changes and goals are not achieved results. Use the written instructions and check local conditions before applying a method.
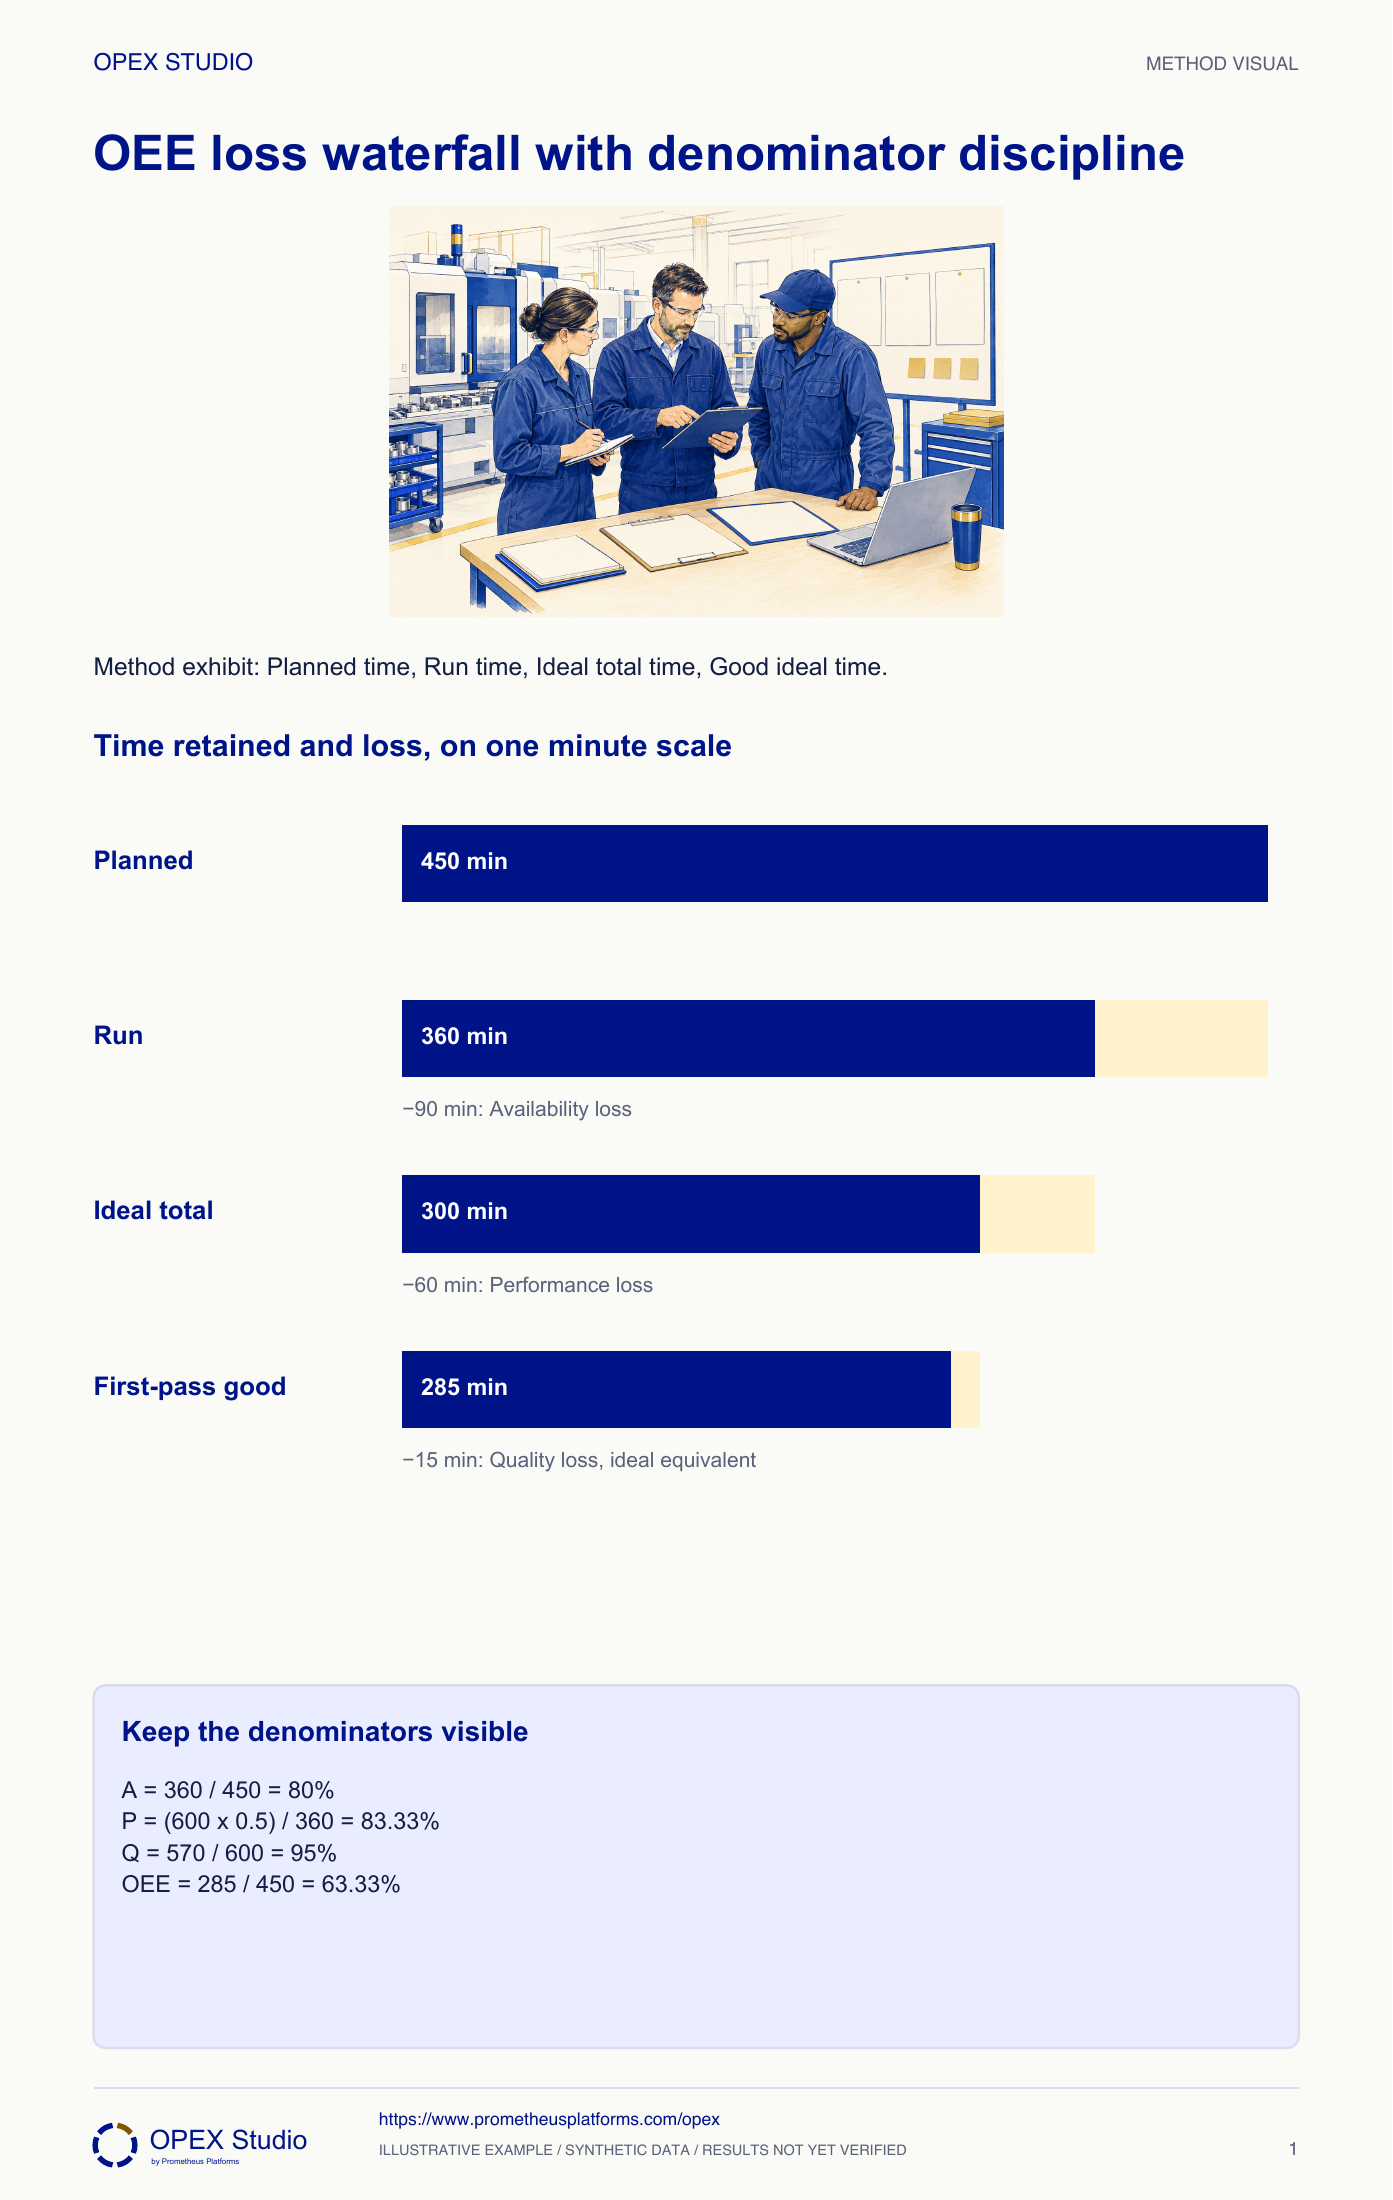
Declare the planned production time before calculating equipment effectiveness. In this exercise, 360 run minutes from 450 planned minutes gives 80% availability. Six hundred units at an ideal half-minute each represent 300 ideal minutes, giving 83.33% performance during run time. Of those units, 570 are good first time, giving 95% quality. Multiplying the three factors yields 63.33% OEE, equivalent to 285 good ideal minutes out of 450. Investigate the underlying loss rather than chasing the score. Reworked output is not first-pass good, and making unwanted inventory cannot establish better customer flow.
Availability 360/450 = 80%; performance (600 × 0.5)/360 = 83.33%; quality 570/600 = 95%.
OEE = 63.33%, equivalent to 285 first-pass-good ideal minutes / 450 planned minutes. Losses are 90 + 60 + 15 = 165 min.
Use first-pass good output; avoid double-counting losses or chasing local utilization when customer demand is absent.

Fictional machine-shift record: 450 minutes were planned for production, the machine ran 360 minutes and made 600 units, of which 570 were first-pass good. The approved ideal cycle for this exercise is 0.5 minute per unit. Analyst Tessa must explain the loss picture before recommending improvement work.
Keep first-pass quality at 570 / 600 = 95% for this defined original pass and record rework/recovery separately. Clarify how any rework resource/time enters the relevant reporting scope.
Recovery changes disposition, not first-pass history. Mixing scopes can count output or time twice.
Reconcile OEE factors and equivalent-time losses, retain first-pass quality accounting and choose a loss investigation without mistaking the percentage for a cause.
Fictional machine-shift record: 450 minutes were planned for production, the machine ran 360 minutes and made 600 units, of which 570 were first-pass good. The approved ideal cycle for this exercise is 0.5 minute per unit. Analyst Tessa must explain the loss picture before recommending improvement work.
Role: Production analyst with operator, quality and maintenance representatives.
Time scope, count definitions and ideal cycle are explicit and consistent; the factors reconcile to good ideal time divided by planned time.
The dashboard shows a low result but the team is treating all lost time as downtime and counting reworked units as first-pass good.
| Input | Supplied value |
|---|---|
| Planned production time | 450 min |
| Run time | 360 min |
| Total units | 600 |
| First-pass good units | 570 |
| Ideal cycle | 0.5 min/unit |
| Non-first-pass units | 30; disposition does not change first-pass history |
Divide 360 run minutes by 450 planned minutes to obtain 80%. The difference is 90 minutes of availability loss under the supplied time definition.
Why: The denominator must remain the agreed planned scope; removing a loss from the denominator would improve the number without improving the work.
Evidence: 450 = 360 + 90 minutes.
600 total units at 0.5 ideal minute require 300 ideal minutes. Divide 300 by 360 run minutes to obtain 83.33% performance.
Why: Performance compares ideal output time with run time; it is not another downtime subtraction.
Evidence: 360 minus 300 = 60 minutes performance loss equivalent.
Divide 570 first-pass good units by 600 total units to obtain 95% quality. Good ideal time is 570 × 0.5 = 285 minutes.
Why: Later rework may recover product but does not undo the original failure to be good first pass.
Evidence: 300 minus 285 = 15 minutes quality loss at ideal time.
Multiply 0.80 × 0.833333… × 0.95 = 0.633333…, or 63.33%. Check 285 / 450 gives the same result. Review loss events with the responsible teams before selecting an investigation.
Why: OEE locates loss categories but does not identify a failed component, prove a cause or justify maximizing every machine’s output.
Evidence: 90 + 60 + 15 + 285 = 450 minutes; actual causes require event evidence.
| Stage / factor | Calculation | Result / loss |
|---|---|---|
| Availability | 360 / 450 | 80%; 90 min loss |
| Performance | 600 × 0.5 / 360 | 83.33%; 60 min equivalent |
| Quality | 570 / 600 | 95%; 15 min ideal equivalent |
| OEE | 285 / 450 | 63.33% |
| Reconcile | 90 + 60 + 15 + 285 | 450 min total |
The 30 non-first-pass units include 20 subsequently reworked and accepted. A colleague proposes changing first-pass good from 570 to 590.
Keep first-pass quality at 570 / 600 = 95% for this defined original pass and record rework/recovery separately. Clarify how any rework resource/time enters the relevant reporting scope.
Recovery changes disposition, not first-pass history. Mixing scopes can count output or time twice.
Retain the original counts, rework identities, subsequent disposition and approved time-accounting rule.
New fictional record: 480 planned minutes, 400 run minutes, 800 total units, 750 first-pass good and an approved ideal cycle of 0.4 min/unit. Twenty failed units are later recovered; do not change the original first-pass count.
| Input | Value |
|---|---|
| Planned / run | 480 / 400 min |
| Total / first-pass good | 800 / 750 units |
| Ideal cycle | 0.4 min/unit |
| Later recovered | 20; separate disposition |
Availability is 400 / 480 = 83.33%; performance is 800 × 0.4 / 400 = 80%; quality is 750 / 800 = 93.75%. OEE is 62.5%, also 300 good ideal minutes /480.
Availability loss is 80 minutes; performance loss is 400 minus 320 = 80 minutes; quality ideal loss is 320 minus 300 = 20 minutes. These plus 300 good ideal minutes total 480.
The 20 later recovered units do not change 750 first-pass good. The loss categories suggest questions, not a diagnosis or proof of customer throughput improvement.
| Measure | Worked result |
|---|---|
| Availability / performance / quality | 83.33% / 80% / 93.75% |
| OEE | 62.5%; 300 / 480 |
| Losses | 80 + 80 + 20 = 180 min |
| Reconcile | 180 + 300 = 480 min |
| Recovery | 20 separate; first-pass good remains 750 |
Which time is planned, run and ideal?
Where do the 15 quality-loss minutes come from?
Can both OEE paths agree?
What event evidence is needed before choosing a repair?
Calculate factors and direct good-ideal-time ratio independently, then use their agreement as a reconciliation check.
Owner: Performance-data owner with production, quality and maintenance
Record: Controlled shift loss record linked to time and unit events
Review: At loss review and after a targeted countermeasure trial
Evidence: Consistent definitions, reconciled counts/time and observed loss mechanisms
Repair data scope or investigate event records before changing targets or attributing causes.
Availability × performance × quality and loss categories
Method reference; original OPEX scenario and diagram are synthetic teaching content, not source case results.Read the lessons online or use these PDFs to prepare, practise and review with your team. No sign-in needed.
Case objectives, demonstration plans, debriefs, common mistakes and application checks across all 81 workplace cases and method lessons.
Download Facilitator guide PDF · 166 pages · 65.1 MBPrintable case worksheets, blank observation records and five calculation exercises; answers are separate.
Download Learner workbook PDF · 169 pages · 10.7 MBReasoned sample responses, worked calculations and coaching guidance; fictional examples are clearly labelled.
Download Answer key and coaching notes PDF · 105 pages · 8.5 MBThe native method mechanisms and worked applications for all 68 detailed lessons, in a separate bookmarked portrait reference.
Download Method and application reference PDF · 141 pages · 10.2 MBFive illustrated system chapters: 15 Flare concept maps and 26 original workplace teaching cards, with links to all 81 supporting cases and method lessons.
Download Illustrated systems atlas PDF · 69 pages · 55.8 MBExplore this connected method and its separate application conditions.
Explore the connected method →Explore this connected method and its separate application conditions.
Explore the connected method →Explore this connected method and its separate application conditions.
Explore the connected method →Explore this connected method and its separate application conditions.
Explore the connected method →