Facilitator guide
Case objectives, demonstration plans, debriefs, common mistakes and application checks across all 81 workplace cases and method lessons.
Download Facilitator guide PDF · 166 pages · 65.1 MB OPEXSTUDIO
Preserve product, source, shift or other relevant labels.. Follow the visual, practise a decision, then check your thinking.
Fictional teaching examples and AI-generated illustrations. Proposed changes and goals are not achieved results. Use the written instructions and check local conditions before applying a method.
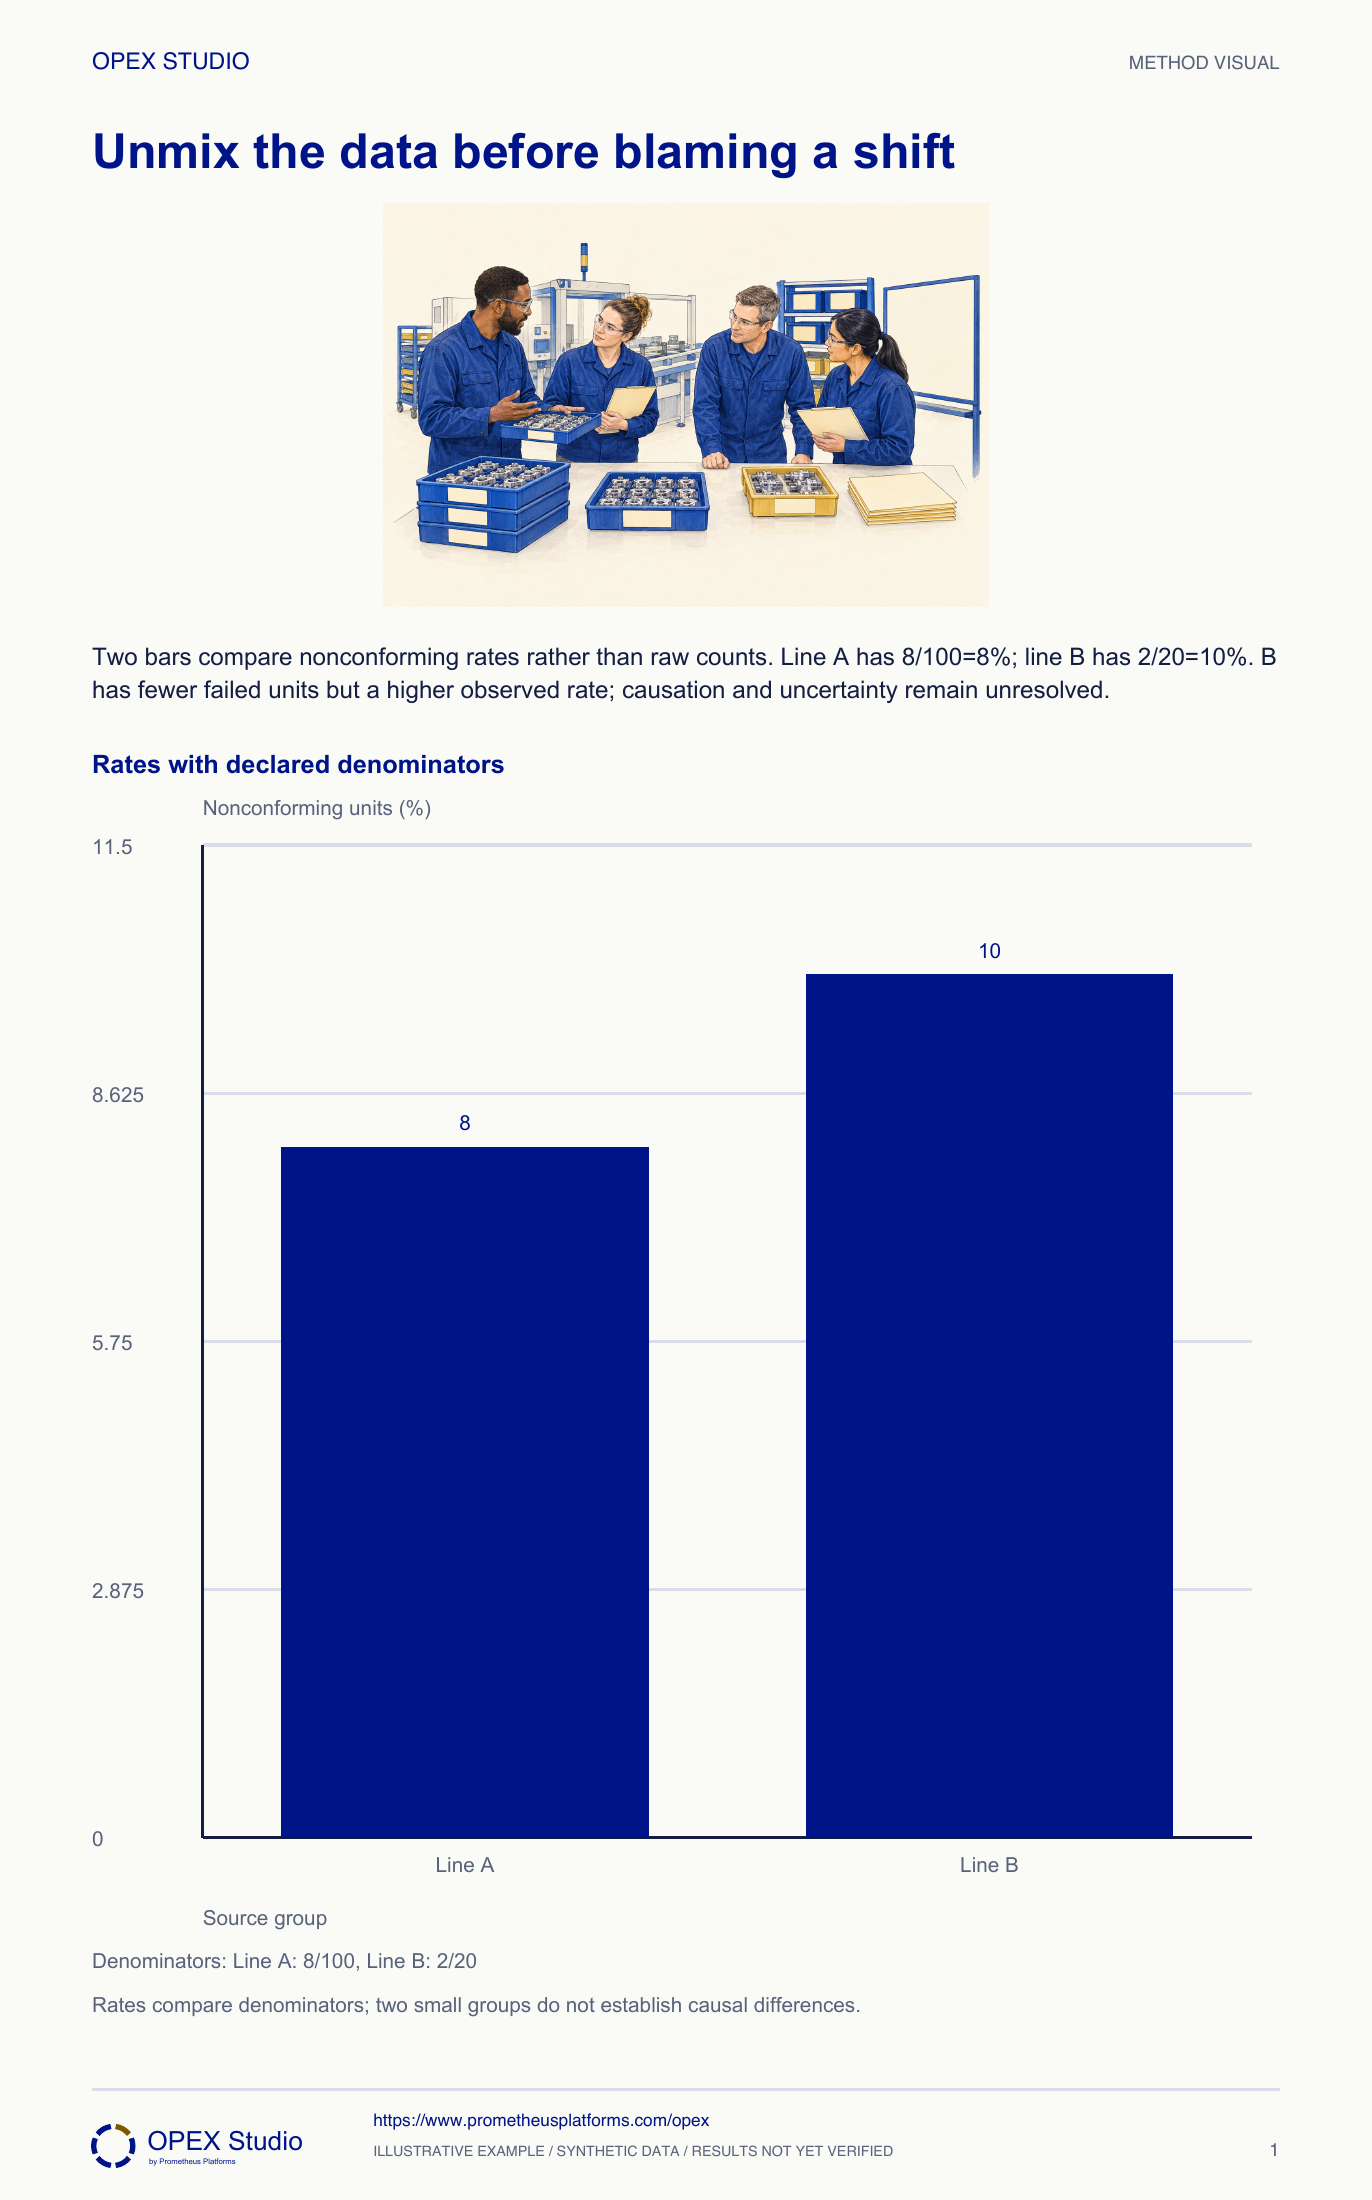
Stratification keeps meaningful source labels attached to the evidence. Pooling machines, shifts, products or suppliers can conceal patterns and can also create misleading comparisons. Define comparable opportunities before dividing the data into groups. In this example the smaller count belongs to the line with the higher observed nonconforming percentage. That difference still does not prove a line effect: the groups may have different products, inspection methods or random uncertainty. Compare relevant strata, examine the underlying process and retain the pooled view for context. Do not use a convenient grouping as a shortcut for blaming people.
A=8/100=8%; B=2/20=10%.
Pooled=10/120=8.33%.
Product mix, measurement and uncertainty remain possible explanations.
Fictional case: Brook Assembly reports eight nonconforming units from 100 inspected on line A and two from 20 on line B. Those values remain unchanged in the core exhibit. Supervisor Mara wants to congratulate line B for having fewer failures and assign corrective training to line A. Analyst Jo must reconstruct a fair comparison before the meeting.
Separate the products where enough comparable observations exist, retain pooled and stratified views, and report gaps where one line has no matching product.
A convenient aggregate can hide or reverse relationships. Do not manufacture comparable groups by discarding inconvenient units without an explicit rule.
Compare meaningful groups with their denominators and context, and distinguish an observed difference from a causal explanation.
Fictional case: Brook Assembly reports eight nonconforming units from 100 inspected on line A and two from 20 on line B. Those values remain unchanged in the core exhibit. Supervisor Mara wants to congratulate line B for having fewer failures and assign corrective training to line A. Analyst Jo must reconstruct a fair comparison before the meeting.
Role: Quality analyst with both line leaders
The response definition, observation period and inspection method are comparable. Each source retains numerator, denominator and product/operating context.
Raw counts hide unequal inspection amounts. Product mix, inspection differences and small-sample uncertainty remain unresolved.
| Source | Nonconforming / inspected | Known context |
|---|---|---|
| Line A | 8 /100 | Product mix not separated |
| Line B | 2 /20 | Smaller observation group |
| Pooled | 10 /120 | Combines both sources, with unequal weights |
Jo preserves which line produced each inspected unit and confirms the observation window and classification rule. He does not strip source fields after calculating one pooled total.
Why: Stratification is possible only when the collection record carries meaningful group identity. Reconstructing a source from memory would introduce another uncertainty.
Evidence: Each observation retains line, product, time and inspection status where available.
He reports A as 8/100=8% and B as 2/20=10%. He shows the counts next to the percentages rather than presenting equally precise-looking bars without sample sizes.
Why: The line with fewer recorded failures can have the larger observed fraction. Denominator visibility prevents the visual from implying equal evidence amounts.
Evidence: Two percentages with their corresponding inspected populations.
He sums failures and inspected units:10/120=8.33%. He rejects the unweighted average of 8% and 10%, which would be 9%.
Why: Pooling must weight by the underlying population counts. A mean of percentages answers a different question when denominators differ.
Evidence: The pooled numerator and denominator reconcile to both groups.
Jo requests product family, inspection method, sampling timing and relevant operating conditions. He proposes within-product comparisons if both lines make the same products.
Why: A source label locates a pattern but does not explain it. Product mix or measurement differences can account for an apparent source difference.
Evidence: The decision record labels line effect as unverified and names missing stratifiers.
Mara pauses the blame-based training assignment and commissions a comparable observation window while responding to actual nonconforming product under its own procedure.
Why: Better comparison does not mean ignoring known product problems. It means keeping product response separate from an unsupported causal claim about a team.
Evidence: The action names collection improvements and responsible owners rather than declaring a worse shift.
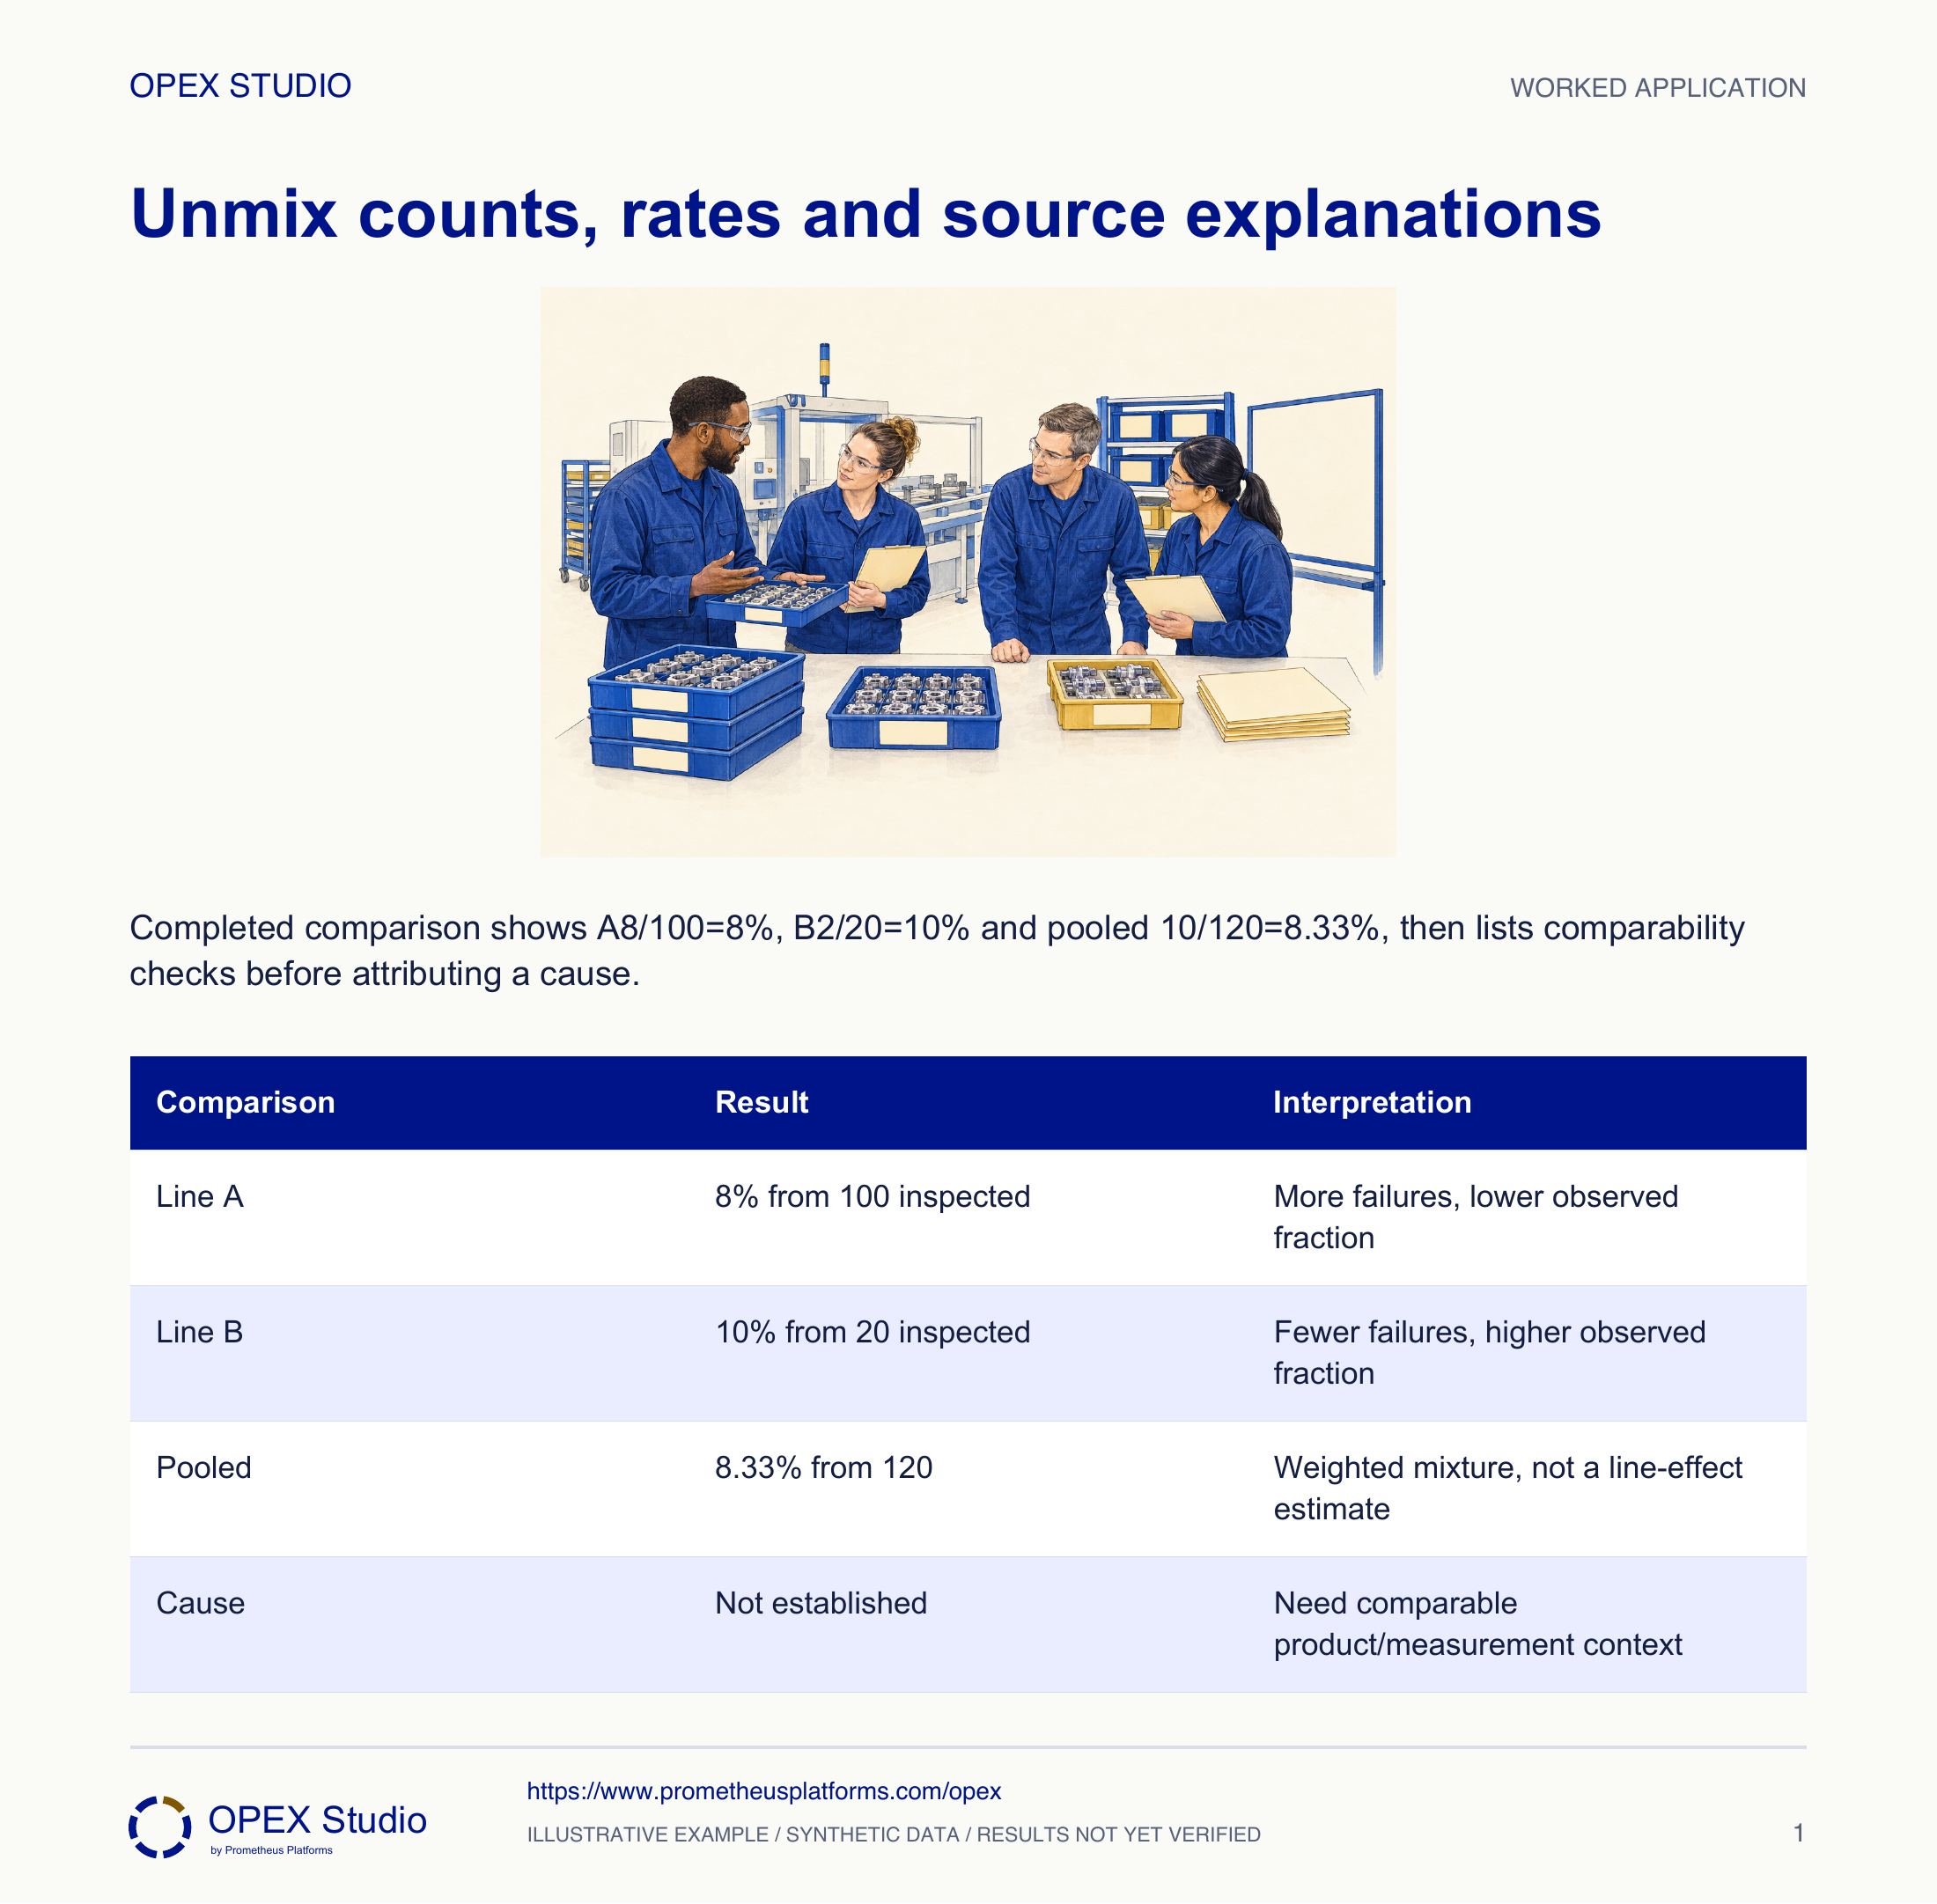
| Comparison | Result | Interpretation |
|---|---|---|
| Line A | 8% from 100 inspected | More failures, lower observed fraction |
| Line B | 10% from 20 inspected | Fewer failures, higher observed fraction |
| Pooled | 8.33% from 120 | Weighted mixture, not a line-effect estimate |
| Cause | Not established | Need comparable product/measurement context |
A later record shows the two lines made very different product mixes.
Separate the products where enough comparable observations exist, retain pooled and stratified views, and report gaps where one line has no matching product.
A convenient aggregate can hide or reverse relationships. Do not manufacture comparable groups by discarding inconvenient units without an explicit rule.
Each comparison declares its product scope and actual exposure.
New fictional records show line C with 3 nonconforming of 30 and line D with 8 of 160. Product mix is still unknown.
| Line | Nonconforming | Inspected |
|---|---|---|
| C | 3 | 30 |
| D | 8 | 160 |
C is 10%; D is 5%. The pooled fraction is 11/190=5.789%, approximately 5.79%. The unweighted average 7.5% gives the small and large groups equal influence.
Request product, sampling and measurement context and collect comparable evidence. The observed difference is not proof that C causes more defects or needs a specific intervention.
| Group | Calculation | Result |
|---|---|---|
| C | 3/30 | 10% |
| D | 8/160 | 5% |
| Pooled | 11/190 | 5.79% |
Which line looks better before dividing?
Why is 8.33% nearer 8%?
What makes a fair product comparison?
Which sentence would unfairly blame a team?
Write a careful meeting statement containing both rates, sample sizes and one remaining uncertainty.
Owner: Quality data owner with process leaders
Record: Source-stratified comparison and collection plan
Review: At the next comparable observation window
Evidence: Consistent classifications, denominators and product context
Improve source capture or sampling before assigning a cause-specific action.
Separate observations by relevant source categories so aggregated data do not conceal patterns.
Public primary-source summary; underlying paid standards/forms are not reproduced.Read the lessons online or use these PDFs to prepare, practise and review with your team. No sign-in needed.
Case objectives, demonstration plans, debriefs, common mistakes and application checks across all 81 workplace cases and method lessons.
Download Facilitator guide PDF · 166 pages · 65.1 MBPrintable case worksheets, blank observation records and five calculation exercises; answers are separate.
Download Learner workbook PDF · 169 pages · 10.7 MBReasoned sample responses, worked calculations and coaching guidance; fictional examples are clearly labelled.
Download Answer key and coaching notes PDF · 105 pages · 8.5 MBThe native method mechanisms and worked applications for all 68 detailed lessons, in a separate bookmarked portrait reference.
Download Method and application reference PDF · 141 pages · 10.2 MBFive illustrated system chapters: 15 Flare concept maps and 26 original workplace teaching cards, with links to all 81 supporting cases and method lessons.
Download Illustrated systems atlas PDF · 69 pages · 55.8 MBExplore this connected method and its separate application conditions.
Explore the connected method →Explore this connected method and its separate application conditions.
Explore the connected method →Explore this connected method and its separate application conditions.
Explore the connected method →