Facilitator guide
Case objectives, demonstration plans, debriefs, common mistakes and application checks across all 81 workplace cases and method lessons.
Download Facilitator guide PDF · 166 pages · 65.1 MB OPEXSTUDIO
Observe arrival variation. Follow the visual, practise a decision, then check your thinking.
Fictional teaching examples and AI-generated illustrations. Proposed changes and goals are not achieved results. Use the written instructions and check local conditions before applying a method.
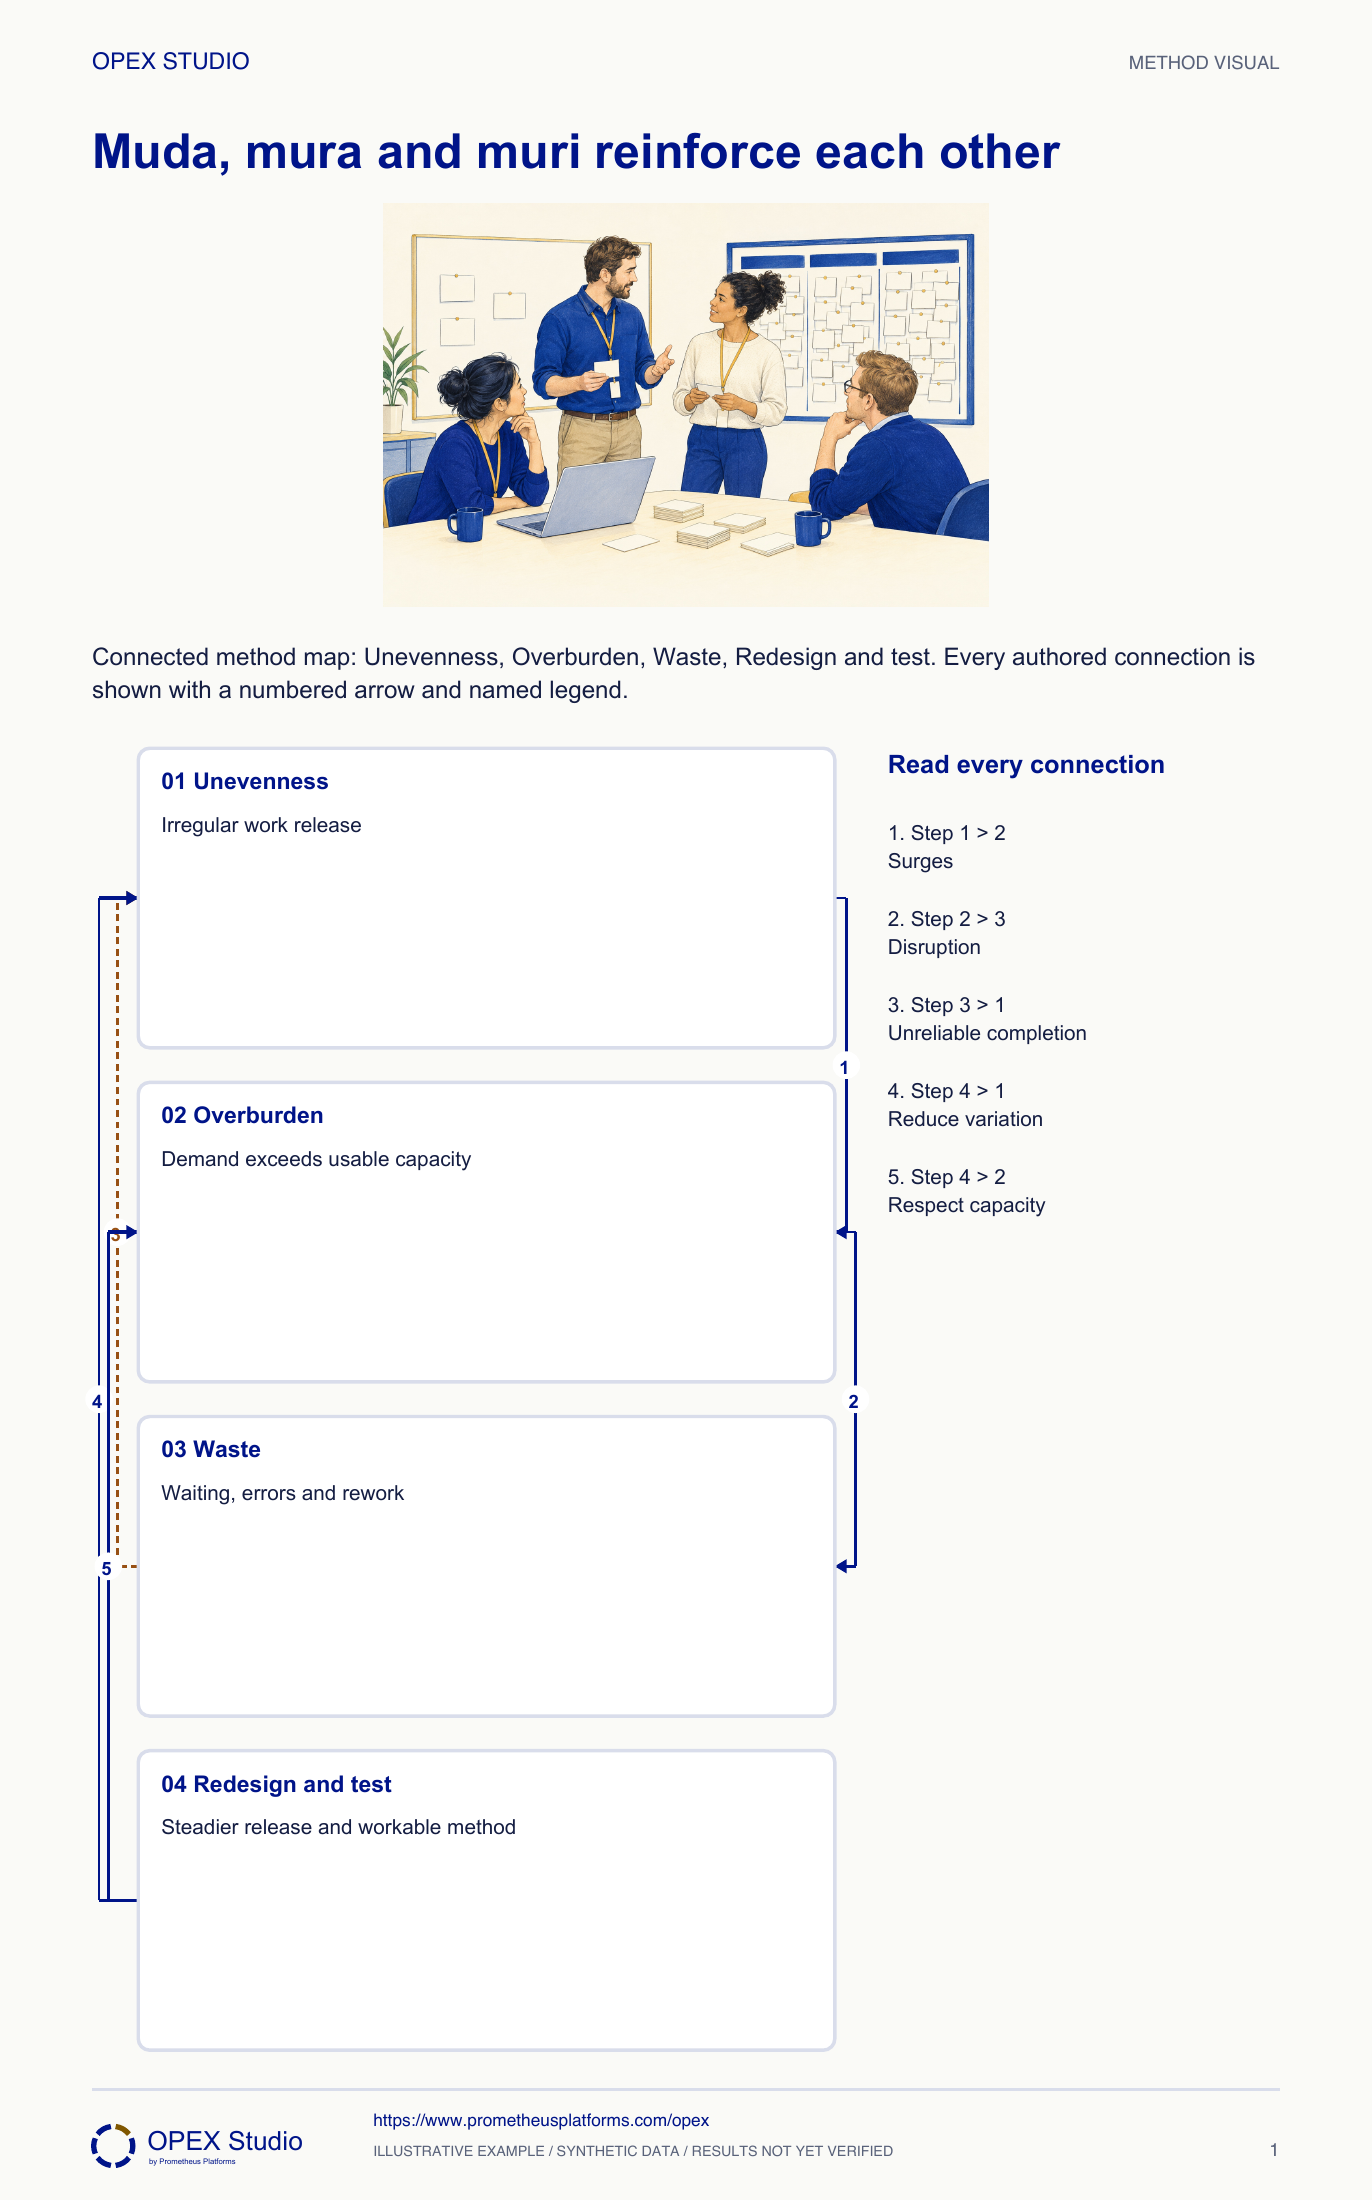
A weekly release surge can make people hurry, create errors and leave others waiting later. Those are connected observations, not three unrelated improvement projects. Ask how work arrives, what capacity is available, and where the method demands unreasonable effort. Then redesign the release or work arrangement with the people affected. A short pause may protect reliability; eliminating it without understanding the system can worsen the outcome. Compare customer service, workload and quality after the change. The aim is an easier, steadier method that removes avoidable waste without transferring burden elsewhere.
Idle capacity is not automatically waste.
Do not remove required checks as non-value work.
Leveling and work balance reduce unevenness; Safety constrains redesign.
Fictional training case: a service coordinator receives 20 complete requests each weekday. An internal manager releases work to the processing team in one large Friday bundle. Analyst Luis asks whether overtime reflects customer demand, the release rule or a lack of capacity.
Reopen the demand and capacity assumptions; do not pretend the release manager created all the unevenness.
The same visual symptom can have a different cause. Options may include agreed lead times, flexible trained capacity or readiness changes, subject to customer needs.
Use daily release and workload evidence to explain how unevenness can produce overburden and waste, then design a test without assuming that all quiet time is removable.
Fictional training case: a service coordinator receives 20 complete requests each weekday. An internal manager releases work to the processing team in one large Friday bundle. Analyst Luis asks whether overtime reflects customer demand, the release rule or a lack of capacity.
Role: Service team leader and request-release owner.
The team works at a sustainable pace and completes accepted requests accurately within the service promise.
The weekly total looks manageable, but a Friday surge produces repeated clarification calls and rushed corrections.
| Day | Customer arrivals | Internal release |
|---|---|---|
| Monday | 20 | 0 |
| Tuesday | 20 | 0 |
| Wednesday | 20 | 0 |
| Thursday | 20 | 0 |
| Friday | 20 | 100 |
| Every day | Sustainable capacity | 25 requests |
Luis plots arrivals and released requests on the same five-day axis. Both total 100, but arrivals are steady and the internal release is concentrated on Friday.
Why: The weekly sum hides the timing mechanism. A demand surge and a management-created release surge require different investigations.
Evidence: Arrivals: 20 each day; release: 0, 0, 0, 0, 100.
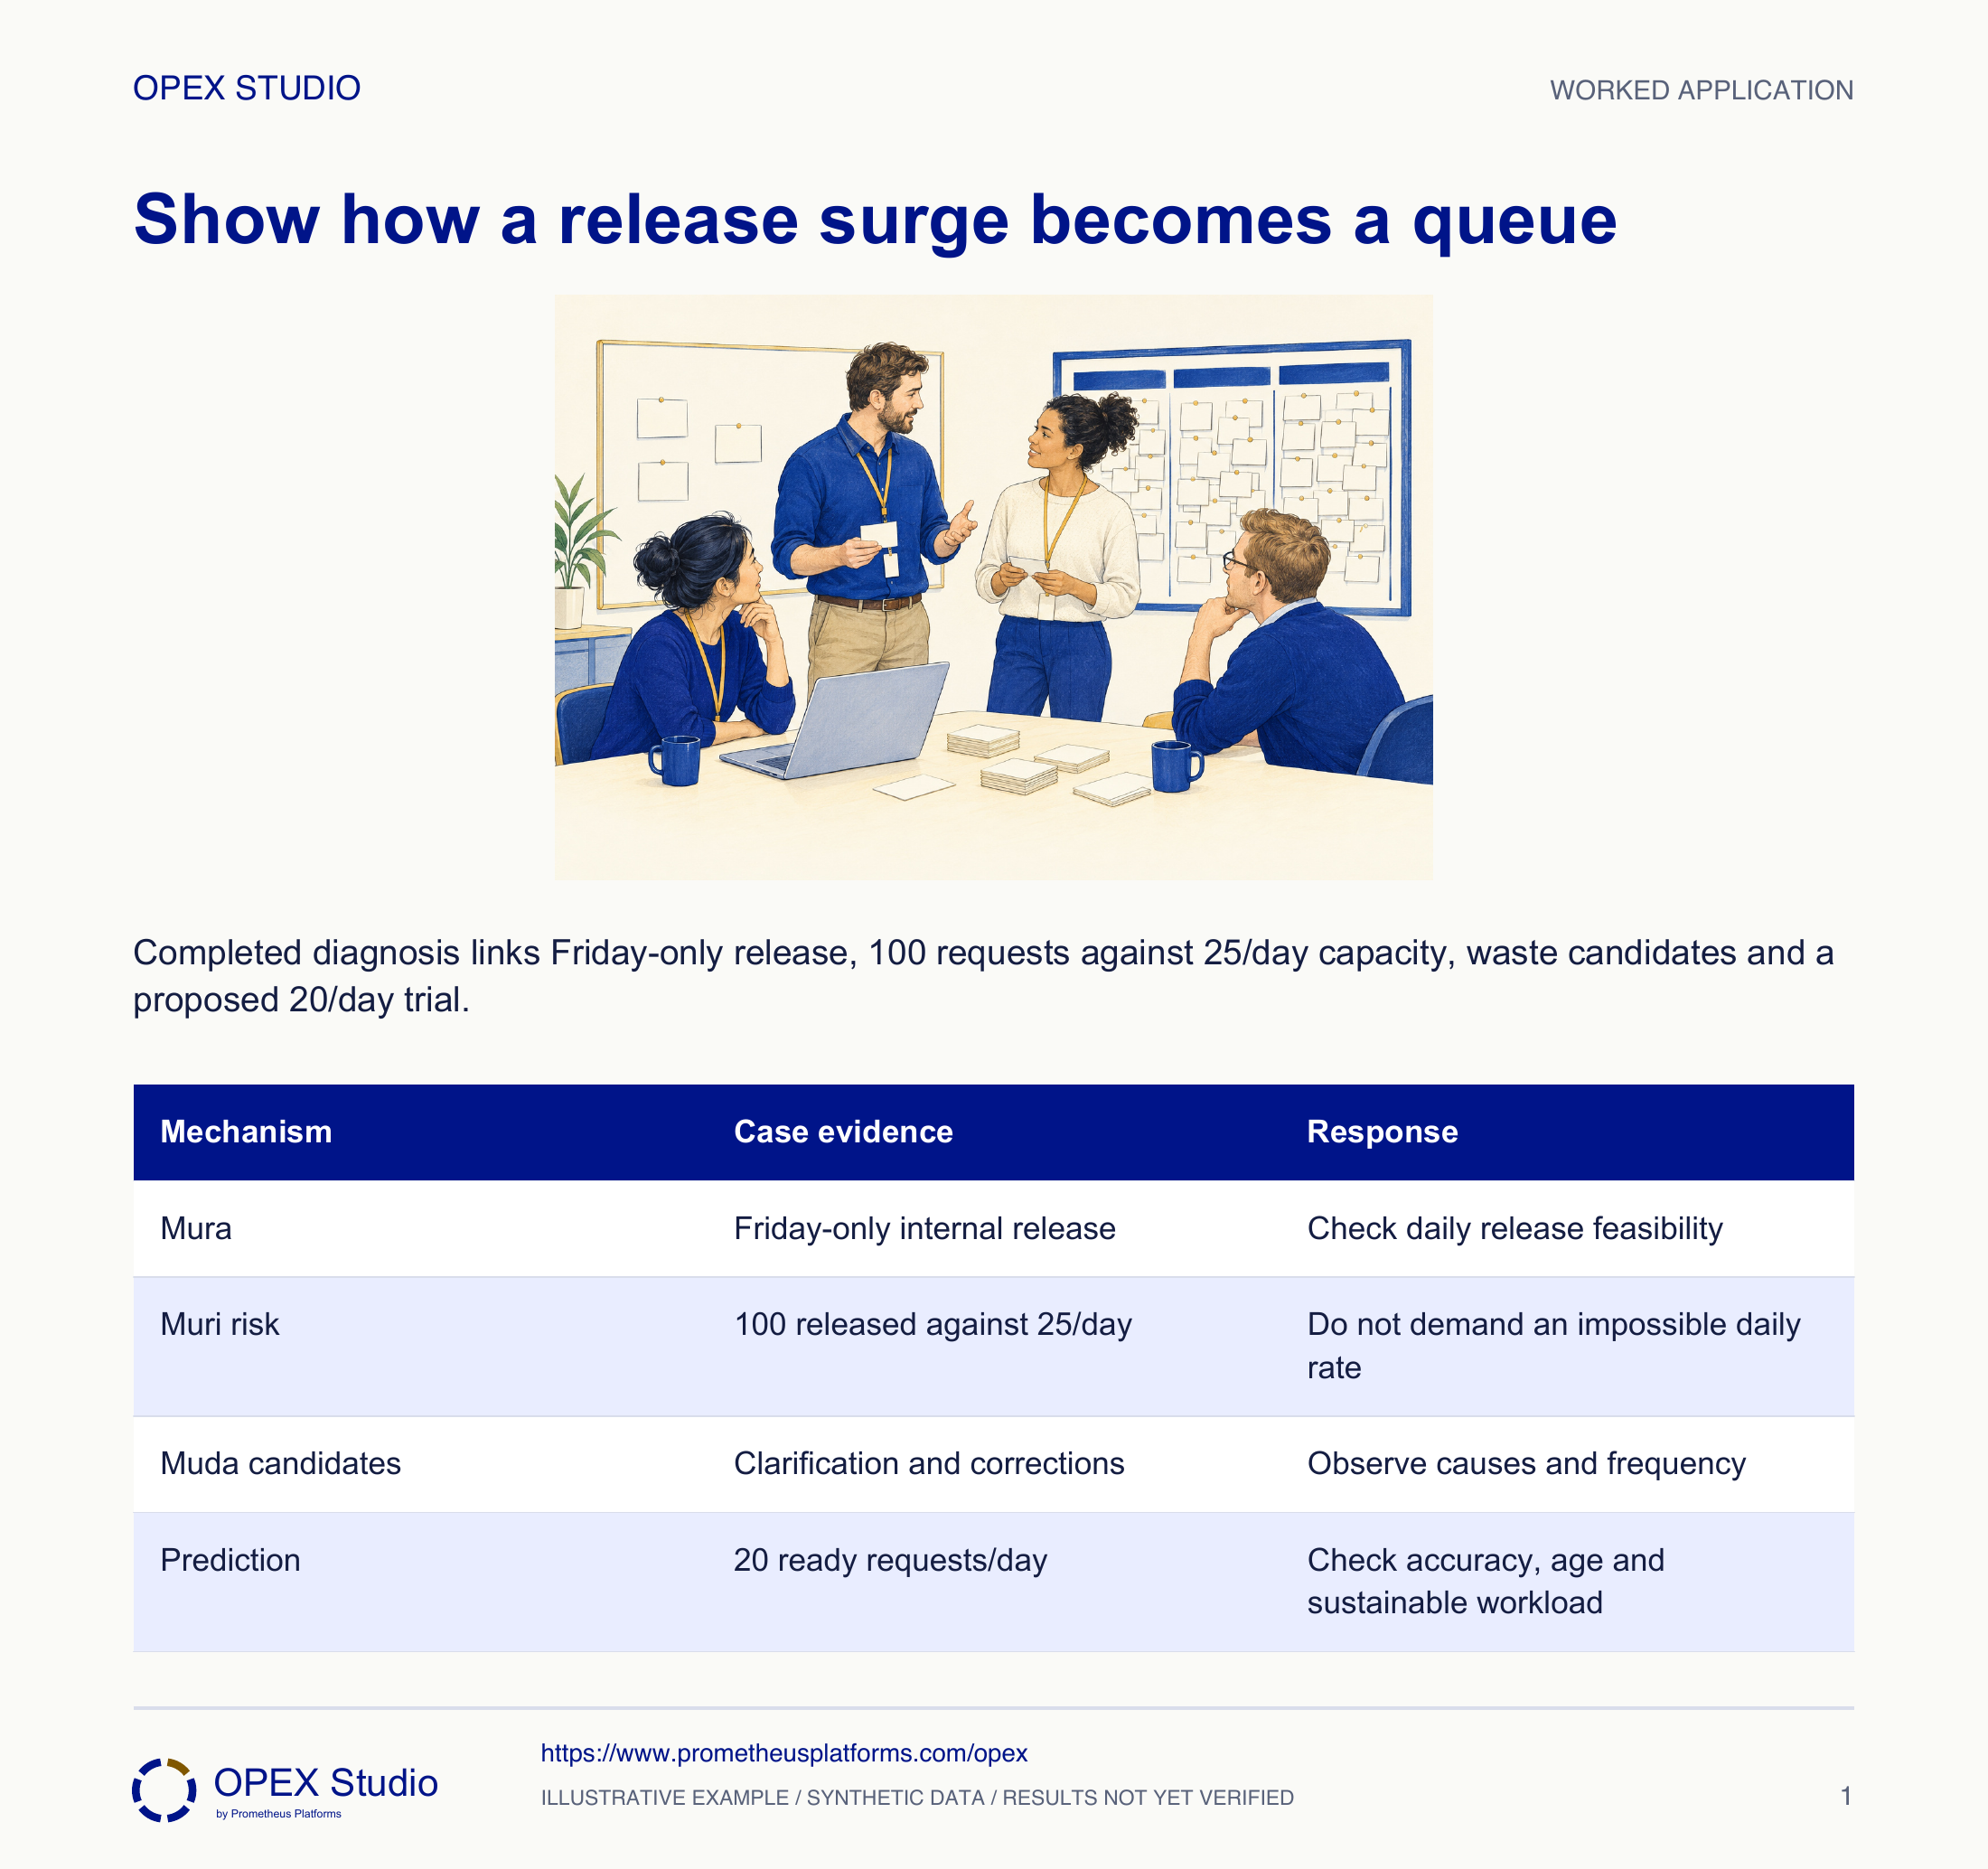
The release pattern is unevenness, or mura. Attempting 100 requests against a sustainable 25-request day is an overburden risk, or muri. Correction and repeat clarification are observed candidates for waste, or muda.
Why: The labels describe linked conditions rather than three boxes into which each person must be placed. Do not diagnose worker effort from a chart.
Evidence: The supplied Friday release is four times the declared daily sustainable capacity.
At the supplied limit, only 25 of the Friday release can be processed that day, leaving 75. Luis records that overtime results and actual quality rates have not been supplied.
Why: A simple queue calculation can expose an impossible promise but cannot prove a medical, ergonomic or capability threshold. The declared capacity is a teaching assumption.
Evidence: First-pass Friday remainder: 100 minus 25 = 75 requests.
The release owner proposes 20 complete requests daily, retaining necessary readiness checks. The team verifies that the information is available and the service promise allows immediate release.
Why: Leveling a controllable internal release may reduce induced overload. It does not mean holding urgent customer work to make a graph smooth.
Evidence: Proposed daily load 20 versus capacity 25; five-request nominal margin, not guaranteed spare capacity.
Record waiting, repeat work, completion accuracy and experienced workload. Keep time for problem solving and response coverage rather than filling every quiet minute with more starts.
Why: Removing visible idle time can remove the ability to absorb normal variation and then recreate overload elsewhere.
Evidence: Trial review compares daily patterns, queues and worker feedback with the original mechanism.
| Mechanism | Case evidence | Response |
|---|---|---|
| Mura | Friday-only internal release | Check daily release feasibility |
| Muri risk | 100 released against 25/day | Do not demand an impossible daily rate |
| Muda candidates | Clarification and corrections | Observe causes and frequency |
| Prediction | 20 ready requests/day | Check accuracy, age and sustainable workload |
A new observation shows 80 requests arrive on Friday and only five on each earlier weekday.
Reopen the demand and capacity assumptions; do not pretend the release manager created all the unevenness.
The same visual symptom can have a different cause. Options may include agreed lead times, flexible trained capacity or readiness changes, subject to customer needs.
Separate arrival and release histories support the revised explanation.
Fictional warranty desk: arrivals are 12 per day, releases are 0, 0, 20, 20, 20, and sustainable capacity is 15 per day. There is no initial backlog.
| Day | Release |
|---|---|
| Monday | 0 |
| Tuesday | 0 |
| Wednesday | 20 |
| Thursday | 20 |
| Friday | 20 |
Wednesday leaves 5; Thursday starts with 5 plus 20 and leaves 10; Friday leaves 15 after processing 15 from 30.
The 60-request weekly load is below 75 theoretical weekly capacity, yet delayed release prevents earlier capacity from serving it.
Twelve ready requests released daily is a testable proposal if readiness and promises permit it. Validate mix, time per request and quality instead of treating the arithmetic as proven capacity.
| Day / proposal | Calculation | Result |
|---|---|---|
| Wednesday | 20 minus 15 | 5 waiting |
| Thursday | 5 plus 20 minus 15 | 10 waiting |
| Friday | 10 plus 20 minus 15 | 15 waiting |
| Proposed | 12/day against 15/day | Test readiness and variation |
What does the weekly total hide?
Which assumption makes the 75-request remainder valid?
Where does Thursday begin: zero or Wednesday’s remainder?
What evidence would identify real demand variation?
Use a separate row for arrivals, release, completion and queue; explain each change before viewing the solution.
Owner: Release owner with service team leader
Record: Daily arrivals/releases/completions, queue age and workload observations
Review: Daily during a limited trial, then at the agreed service review
Evidence: Accurate completion with less induced waiting and no increase in strain or hidden work
Review readiness, real demand variability and trained capacity; retain explicit urgent-work rules.
Waste, unevenness and overburden are interrelated
Method reference; original OPEX scenario and diagram are synthetic teaching content, not source case results.Read the lessons online or use these PDFs to prepare, practise and review with your team. No sign-in needed.
Case objectives, demonstration plans, debriefs, common mistakes and application checks across all 81 workplace cases and method lessons.
Download Facilitator guide PDF · 166 pages · 65.1 MBPrintable case worksheets, blank observation records and five calculation exercises; answers are separate.
Download Learner workbook PDF · 169 pages · 10.7 MBReasoned sample responses, worked calculations and coaching guidance; fictional examples are clearly labelled.
Download Answer key and coaching notes PDF · 105 pages · 8.5 MBThe native method mechanisms and worked applications for all 68 detailed lessons, in a separate bookmarked portrait reference.
Download Method and application reference PDF · 141 pages · 10.2 MBFive illustrated system chapters: 15 Flare concept maps and 26 original workplace teaching cards, with links to all 81 supporting cases and method lessons.
Download Illustrated systems atlas PDF · 69 pages · 55.8 MBExplore this connected method and its separate application conditions.
Explore the connected method →Explore this connected method and its separate application conditions.
Explore the connected method →Explore this connected method and its separate application conditions.
Explore the connected method →