Facilitator guide
Case objectives, demonstration plans, debriefs, common mistakes and application checks across all 81 workplace cases and method lessons.
Download Facilitator guide PDF · 166 pages · 65.1 MB OPEXSTUDIO
Confirm volume and mix. Follow the visual, practise a decision, then check your thinking.
Fictional teaching examples and AI-generated illustrations. Proposed changes and goals are not achieved results. Use the written instructions and check local conditions before applying a method.
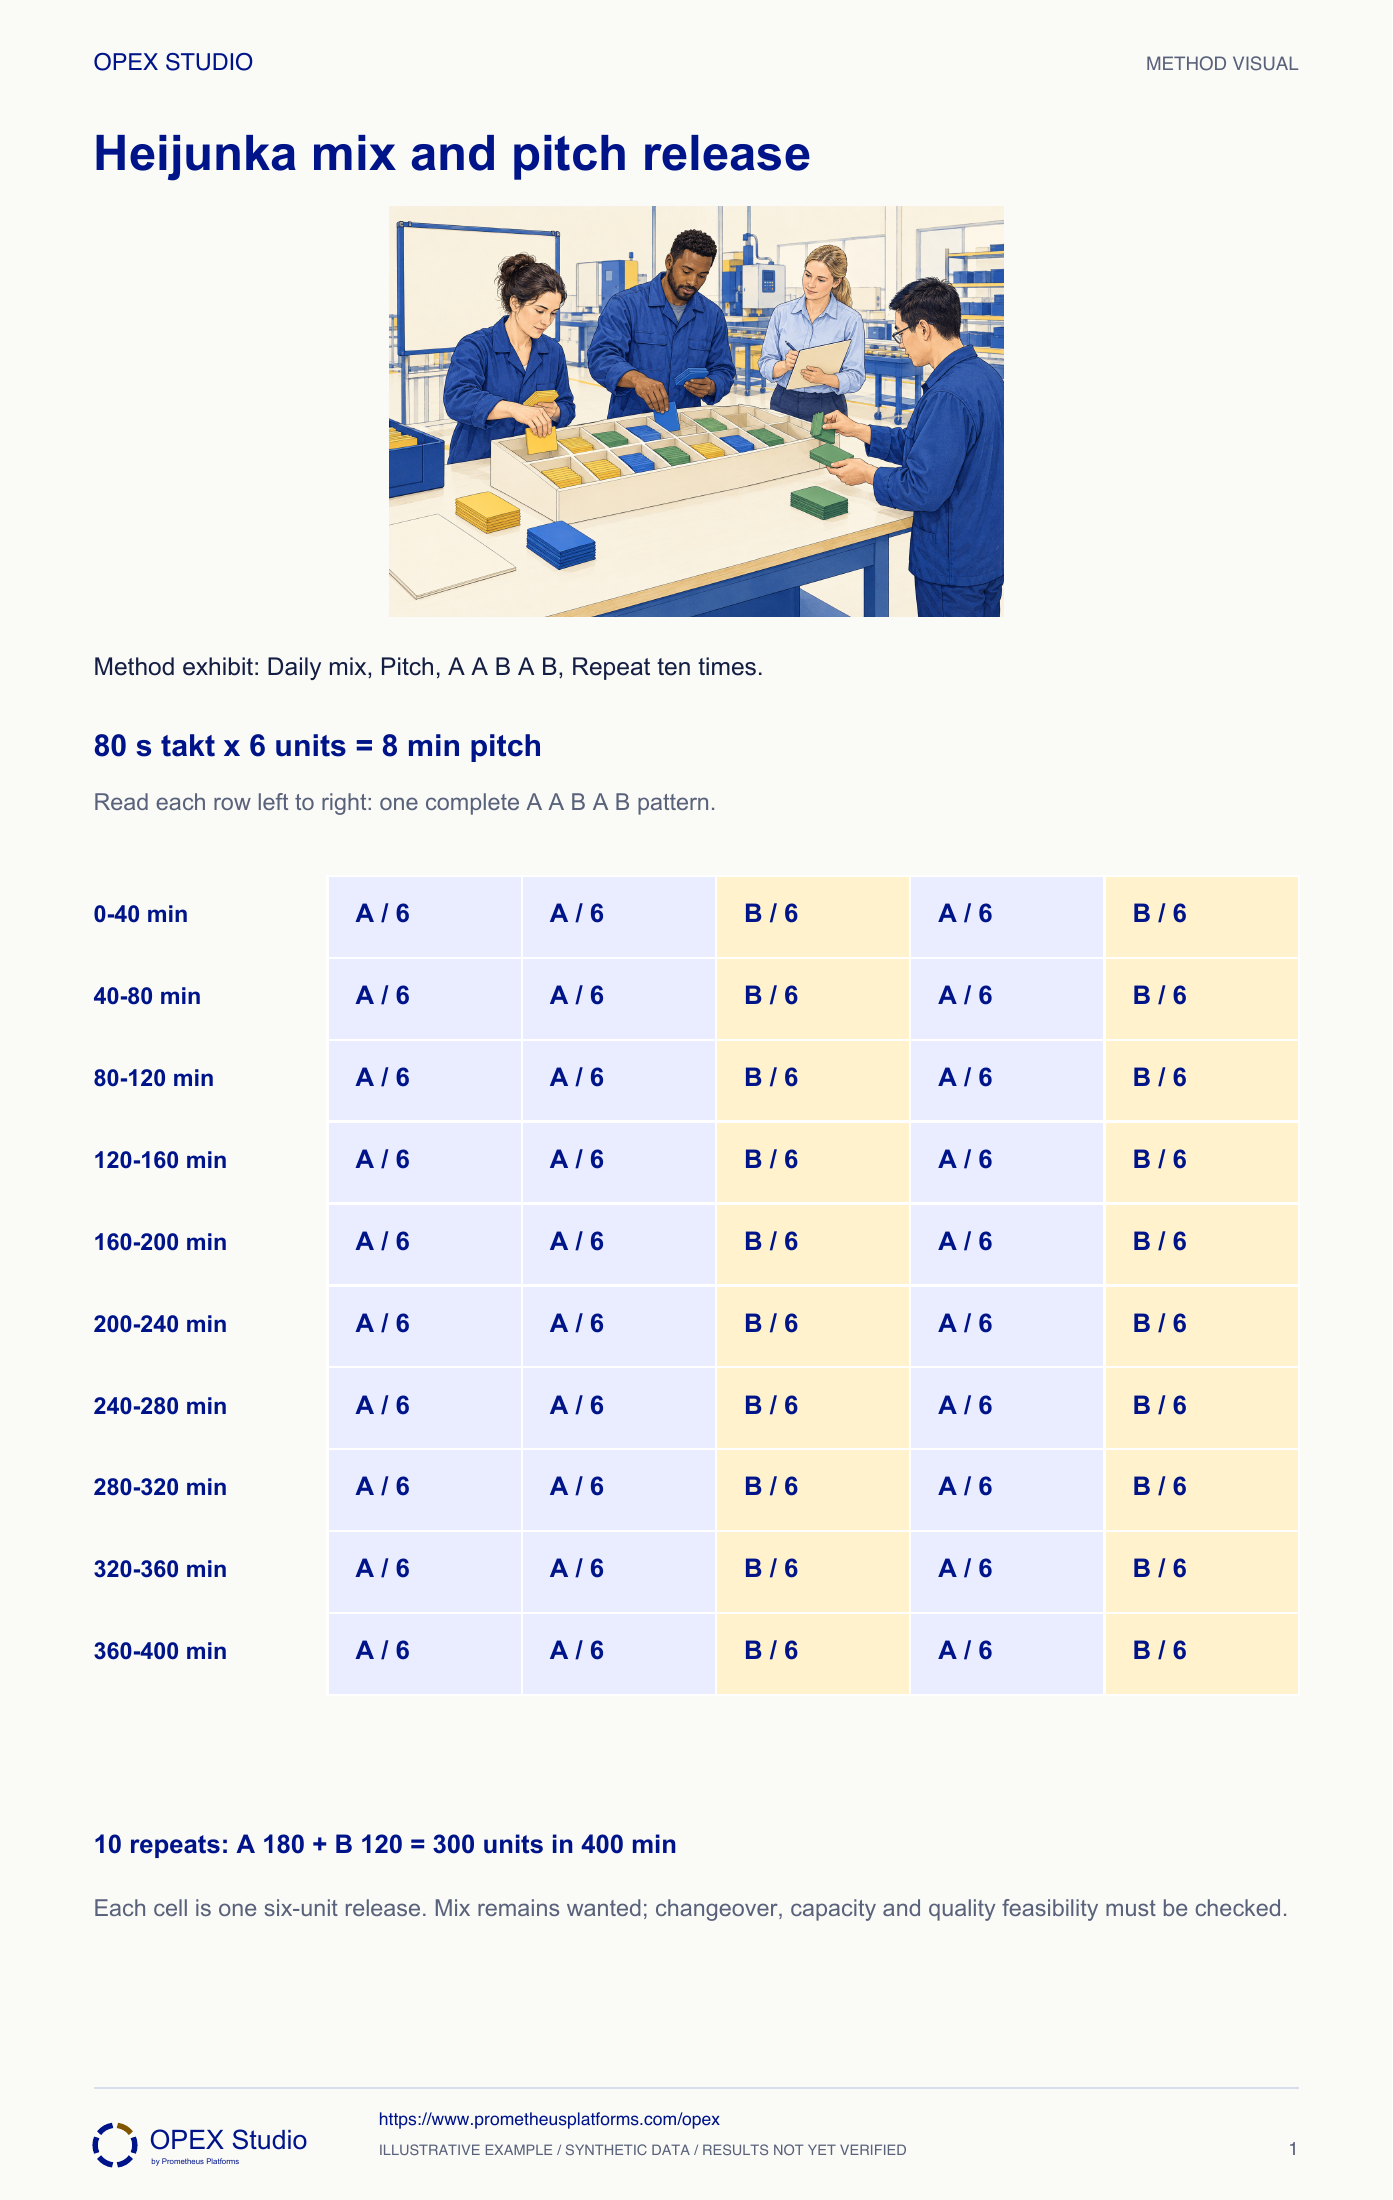
Level both volume and mix over a useful planning horizon. The exercise has 400 available minutes and demand for 300 units, giving an 80-second takt. Six units make an eight-minute pitch. Fifty packs therefore fill the horizon. Repeating AABAB ten times releases 30 A packs and 20 B packs: 180 A units and 120 B units. The box makes the next release and any missed interval visible. Before trialing this pattern, verify changeover time, capacity and actual demand. A tidy repeating schedule is not permission to produce items that are no longer needed.
400 min × 60 / 300 units = 80 sec/unit takt. Six units per pack gives 8 min/pitch.
AABAB × 10 gives 30 A packs and 20 B packs: 180 A + 120 B = 300 units over 50 pitches.
Pattern feasibility depends on demand, changeover capability, quality and capacity; do not manufacture to a stale pattern.
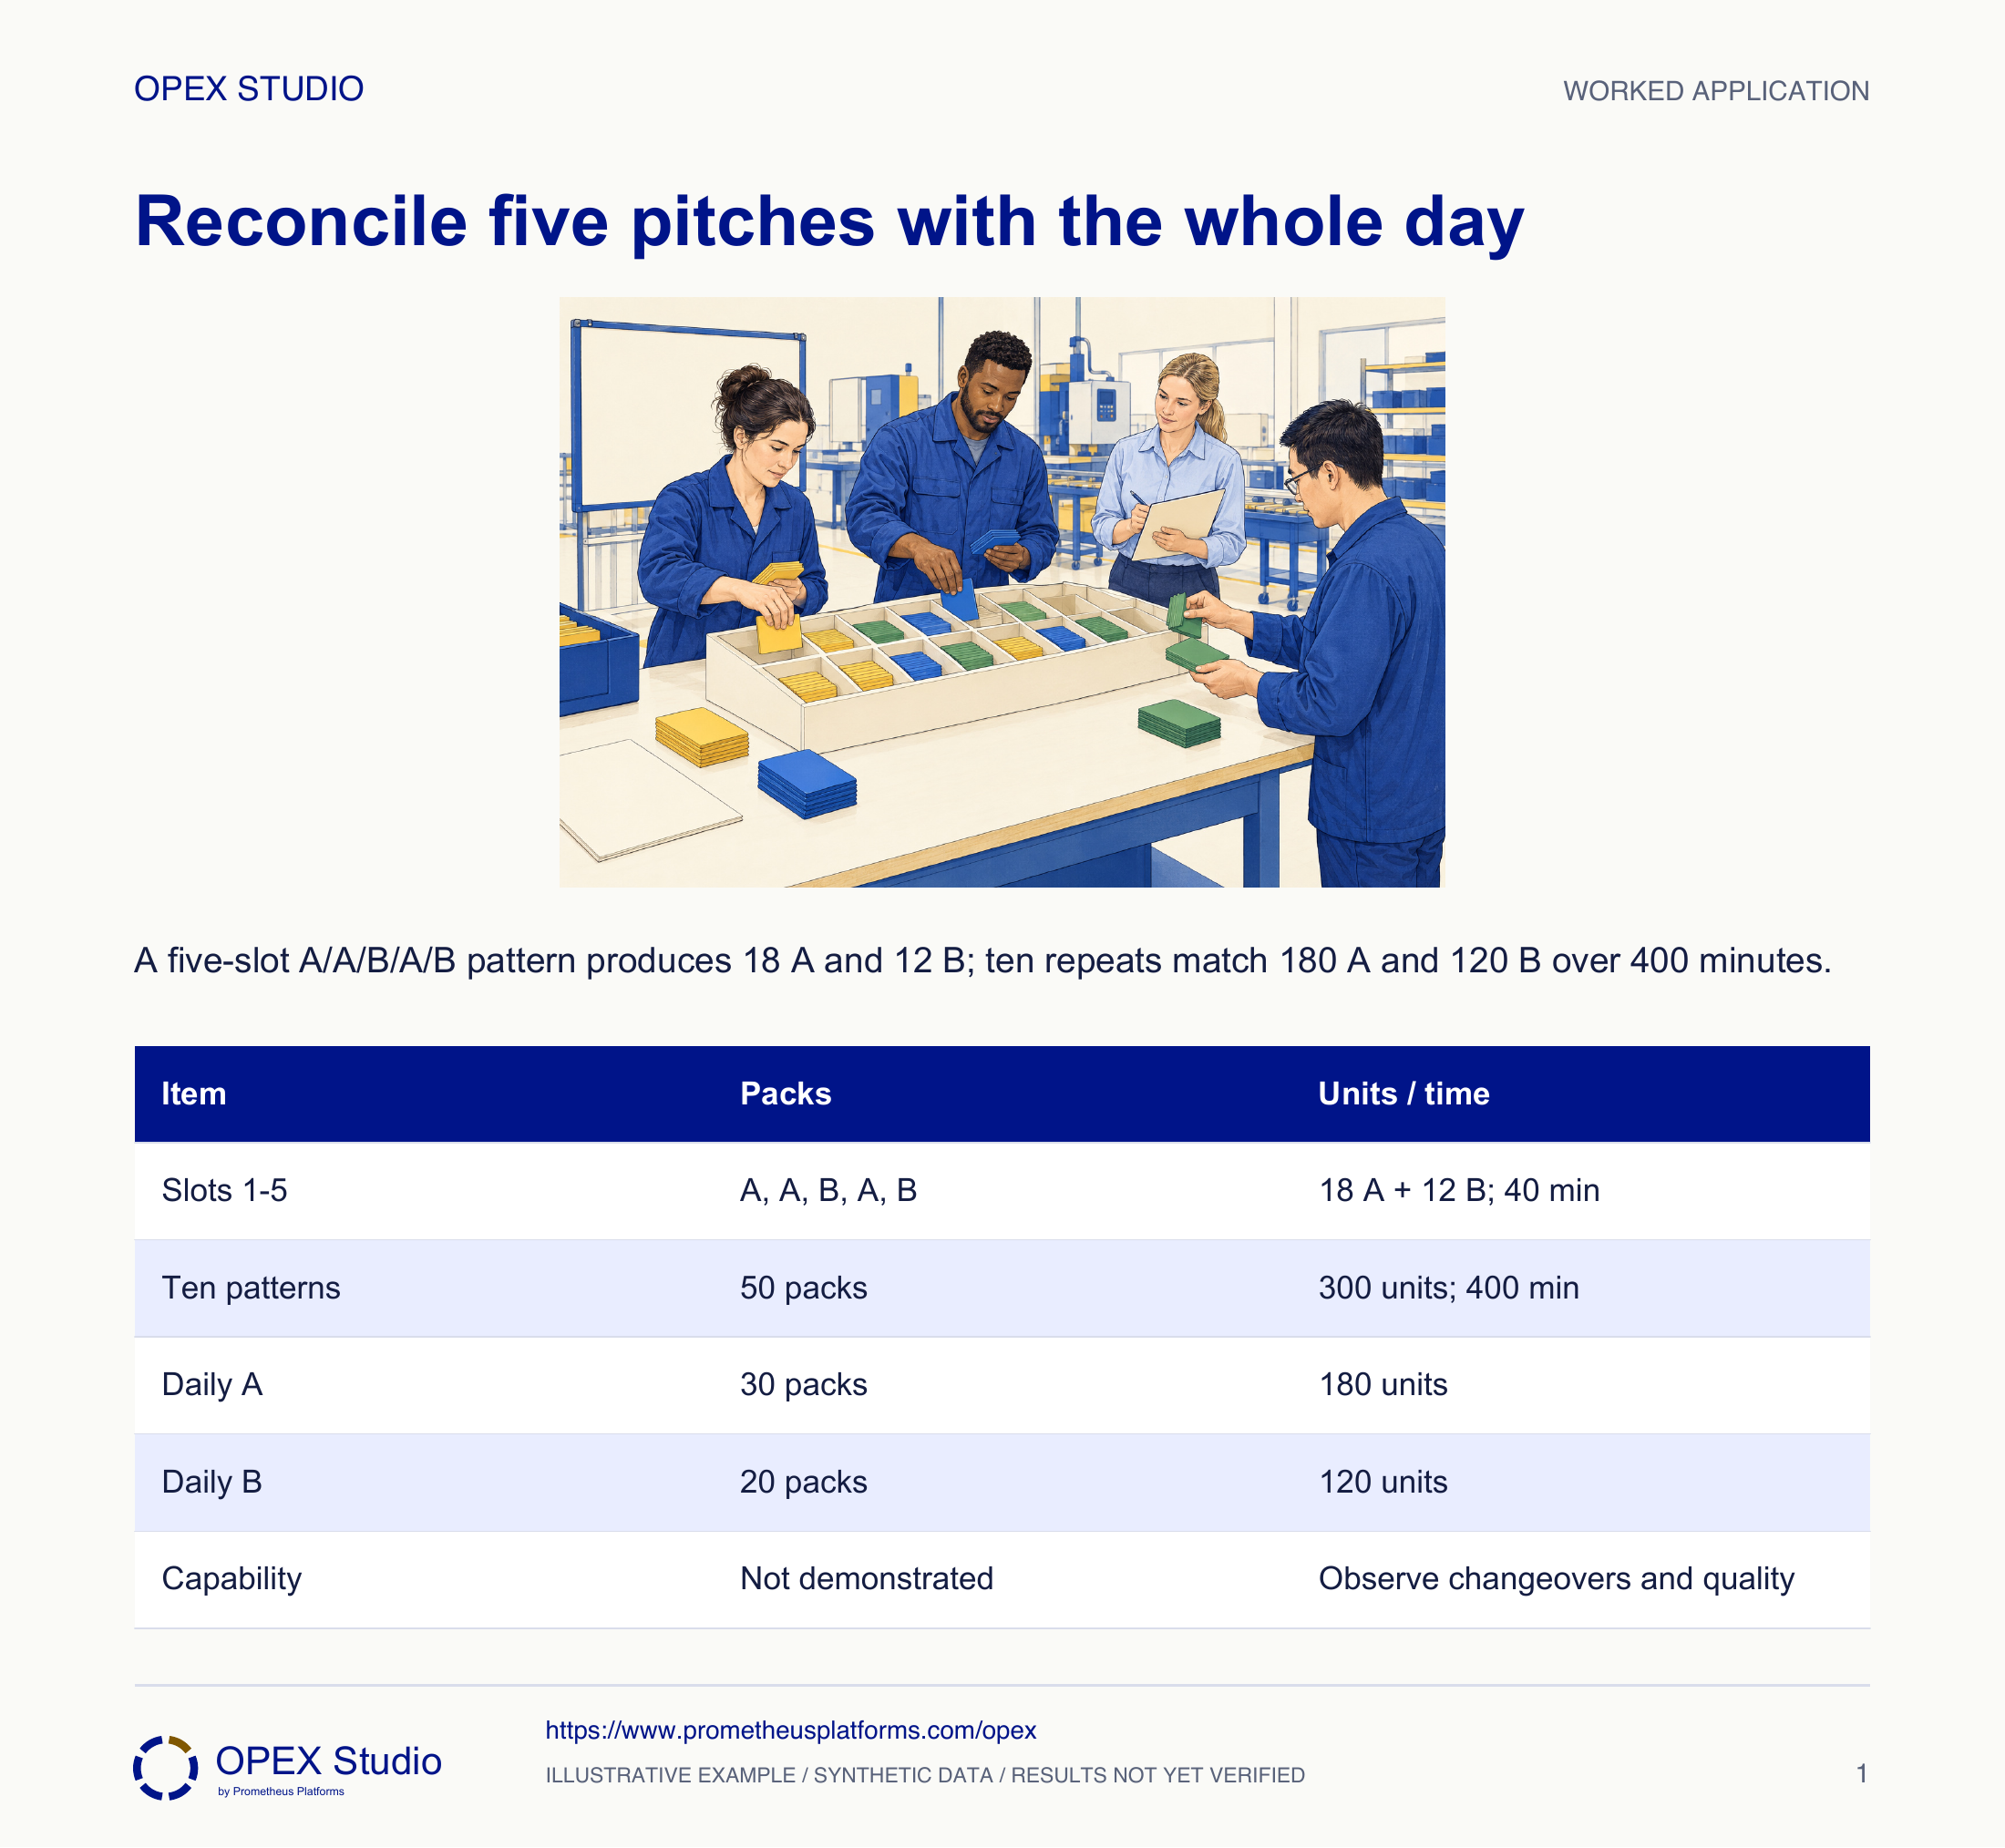
Fictional A/B line: 400 net minutes must serve demand for 180 A and 120 B. Each authorized pack holds six units. Planner Celia proposes the repeating pattern A, A, B, A, B and asks the team to check its quantities, timing and operating assumptions.
Rebuild the mix pattern; retaining the old pattern would make 30 excess A and leave 30 B short.
The unchanged total and takt do not make the old product sequence correct.
Build and reconcile a leveled mix pattern from demand and pack size, while distinguishing a mathematically balanced release plan from a feasible production method.
Fictional A/B line: 400 net minutes must serve demand for 180 A and 120 B. Each authorized pack holds six units. Planner Celia proposes the repeating pattern A, A, B, A, B and asks the team to check its quantities, timing and operating assumptions.
Role: Production planner with operators, quality and changeover owner.
The release pattern represents wanted mix within the available period, with feasible capacity and quality controls.
A neat sequence can conceal infeasible changeovers or obsolete demand.
| Input | Declared value |
|---|---|
| Demand | 180 A + 120 B = 300 units |
| Available time | 400 net min |
| Pack size | 6 units |
| Pattern | A, A, B, A, B |
| Proposed repeats | 10 |
Celia divides 400 × 60 by 300 to obtain 80 seconds per unit. She multiplies by six units per pack and converts 480 seconds to eight minutes per release interval.
Why: Takt is per unit; pitch groups that rhythm into a practical pack-level interval. Confusing the units would make the board impossible to reconcile.
Evidence: 80 sec/unit × 6 units = 480 sec = 8 min per pitch.
Mark five consecutive eight-minute slots A, A, B, A, B. Three A packs give 18 A; two B packs give 12 B. The pattern spans 40 minutes.
Why: One complete repeat exposes both mix and volume. Counting colored slots without pack quantities could confuse packs with finished units.
Evidence: One pattern: 30 units, comprising 18 A and 12 B.
Repeat the pattern ten times. The plan contains 50 pitches, 30 A packs and 20 B packs. Compare both product totals with demand.
Why: A total of 300 is insufficient if it contains the wrong product mix. Time and each product quantity must agree independently.
Evidence: 50 × 8 = 400 min; A = 30 × 6 = 180; B = 20 × 6 = 120.
The team checks changeovers, equipment response, staffing, material readiness and first-piece acceptance against the proposed sequence. It records missing capability data instead of assuming eight minutes is available for any amount of work.
Why: Leveling depends on operating conditions. A visually level board does not absorb unmeasured setup losses or make unavailable material eligible.
Evidence: Feasibility review names the changeover owner and required timing/quality evidence.
Record plan versus eligible completion by pitch and make exceptions visible. Review the pattern when demand or pack size changes; preserve the approved quality response when a pack cannot be completed.
Why: Heijunka is not permission to make an obsolete mix simply to fill every box. The pattern serves customer demand.
Evidence: A missed pitch has a cause and response; it is not silently filled with another unwanted product.
| Item | Packs | Units / time |
|---|---|---|
| Slots 1–5 | A, A, B, A, B | 18 A + 12 B; 40 min |
| Ten patterns | 50 packs | 300 units; 400 min |
| Daily A | 30 packs | 180 units |
| Daily B | 20 packs | 120 units |
| Capability | Not demonstrated | Observe changeovers and quality |
Confirmed demand becomes 150 A and 150 B, still totaling 300.
Rebuild the mix pattern; retaining the old pattern would make 30 excess A and leave 30 B short.
The unchanged total and takt do not make the old product sequence correct.
New plan reconciles each product separately before release.
Separate fictional line: 360 net minutes, demand for 80 A and 160 B, four units per pack. Test the repeated pattern A, B, B.
| Input | Value |
|---|---|
| Net time / demand | 360 min / 240 units |
| Pack size | 4 units |
| Proposed pattern | A, B, B |
Takt is 90 sec/unit and pitch is 360 seconds, or six minutes, per four-unit pack.
One A/B/B repeat produces 4 A and 8 B. Twenty repeats produce 80 A and 160 B, using 60 pitches × 6 = 360 minutes.
The calculation does not verify changeovers, material readiness or achievable quality at this mix.
| Calculation | Intermediate result | Checked result |
|---|---|---|
| Takt / pitch | 90 sec/unit | 6 min/pack |
| One repeat | 3 packs | 4 A + 8 B |
| Twenty repeats | 60 packs | 80 A + 160 B; 360 min |
Which units belong on the release interval?
Where do 18 A and 12 B come from?
Can both mix and time be reconciled?
What could make a correct calculation impossible to run?
Build one repeat first, then multiply and audit the total against each input.
Owner: Planning owner with line and changeover representatives
Record: Mix/pitch plan, feasibility evidence and pitch exceptions
Review: At each planning-basis change and during the controlled trial
Evidence: Wanted units completed with valid quality status and feasible changeover conditions
Revise the release pattern or enabling conditions; do not use overproduction to make the board look complete.
Mix/volume leveling, pitch = takt × pack quantity
Method reference; original OPEX scenario and diagram are synthetic teaching content, not source case results.Read the lessons online or use these PDFs to prepare, practise and review with your team. No sign-in needed.
Case objectives, demonstration plans, debriefs, common mistakes and application checks across all 81 workplace cases and method lessons.
Download Facilitator guide PDF · 166 pages · 65.1 MBPrintable case worksheets, blank observation records and five calculation exercises; answers are separate.
Download Learner workbook PDF · 169 pages · 10.7 MBReasoned sample responses, worked calculations and coaching guidance; fictional examples are clearly labelled.
Download Answer key and coaching notes PDF · 105 pages · 8.5 MBThe native method mechanisms and worked applications for all 68 detailed lessons, in a separate bookmarked portrait reference.
Download Method and application reference PDF · 141 pages · 10.2 MBFive illustrated system chapters: 15 Flare concept maps and 26 original workplace teaching cards, with links to all 81 supporting cases and method lessons.
Download Illustrated systems atlas PDF · 69 pages · 55.8 MBExplore this connected method and its separate application conditions.
Explore the connected method →Explore this connected method and its separate application conditions.
Explore the connected method →Explore this connected method and its separate application conditions.
Explore the connected method →Explore this connected method and its separate application conditions.
Explore the connected method →