Facilitator guide
Case objectives, demonstration plans, debriefs, common mistakes and application checks across all 81 workplace cases and method lessons.
Download Facilitator guide PDF · 166 pages · 65.1 MB OPEXSTUDIO
Measure usage and refill delay. Follow the visual, practise a decision, then check your thinking.
Fictional teaching examples and AI-generated illustrations. Proposed changes and goals are not achieved results. Use the written instructions and check local conditions before applying a method.
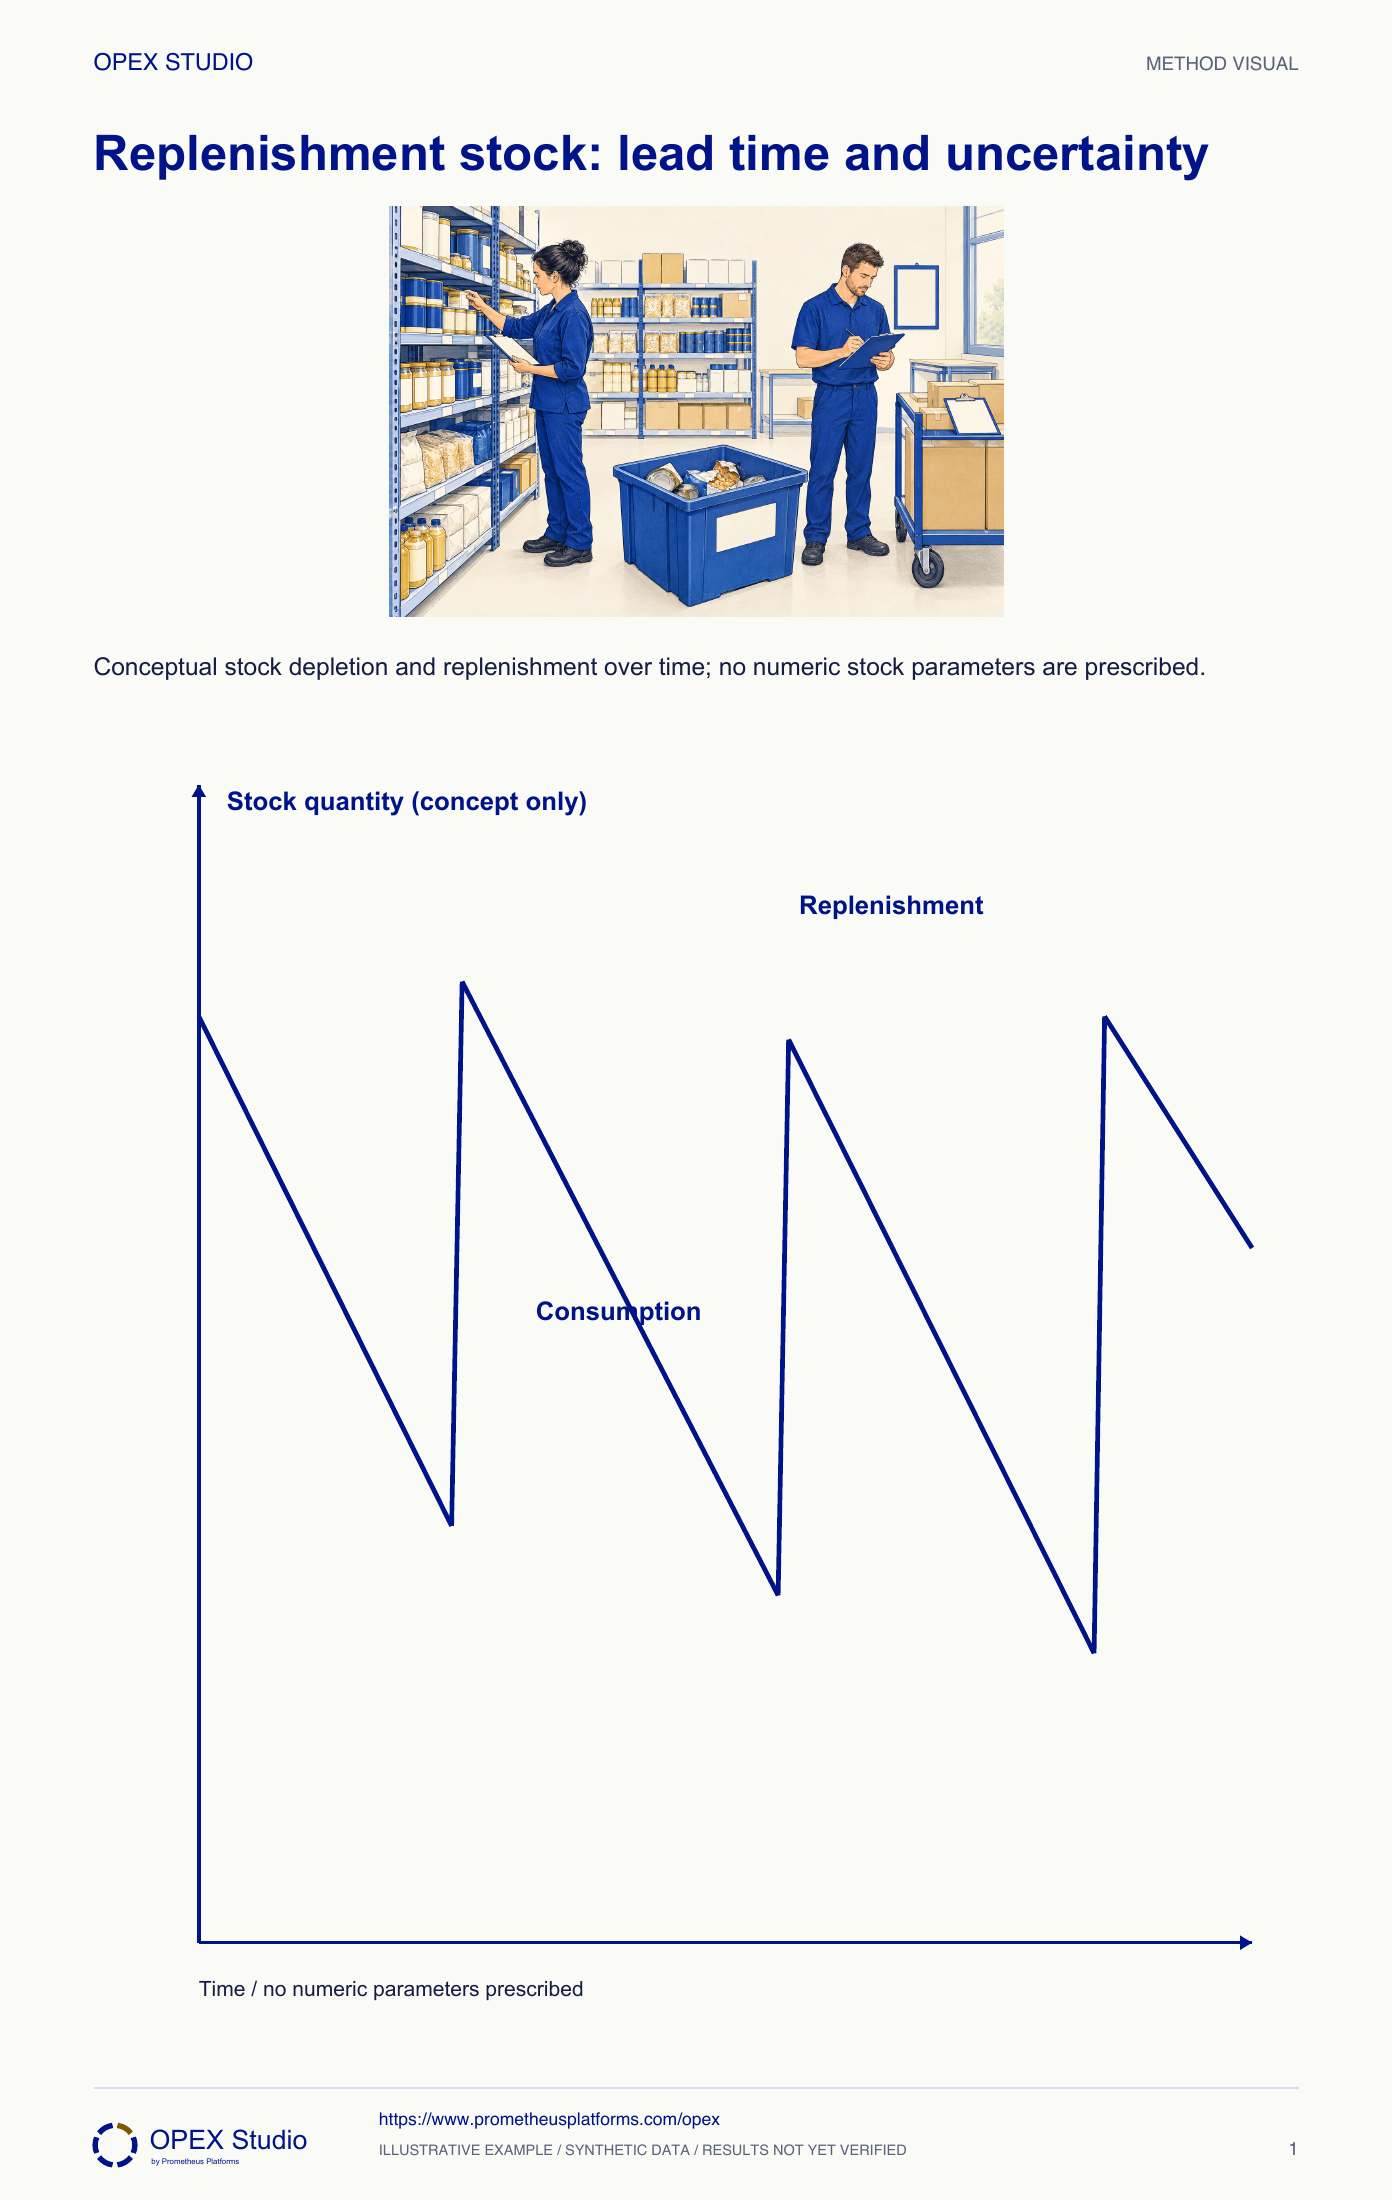
Stock should protect a defined service need during replenishment, with assumptions that can be checked. Observe how quickly an item is used, how long a refill actually takes, and how variable both are. Check the accuracy of on-hand stock and outstanding orders before setting provisional bounds. Trial the rule, record shortages and excess, and adjust from evidence. Shelf space alone is not a demand model. Freshness, handling and supplier pack sizes may constrain the choice. Keep the previous pantry arithmetic as an example of a decision rule, not as universal settings for unrelated items or sites.
Min/max is not arbitrary shelf fullness.
Illustrative buffers are not universal settings.
SMED and reliability affect refill time; PFEP preserves item data.
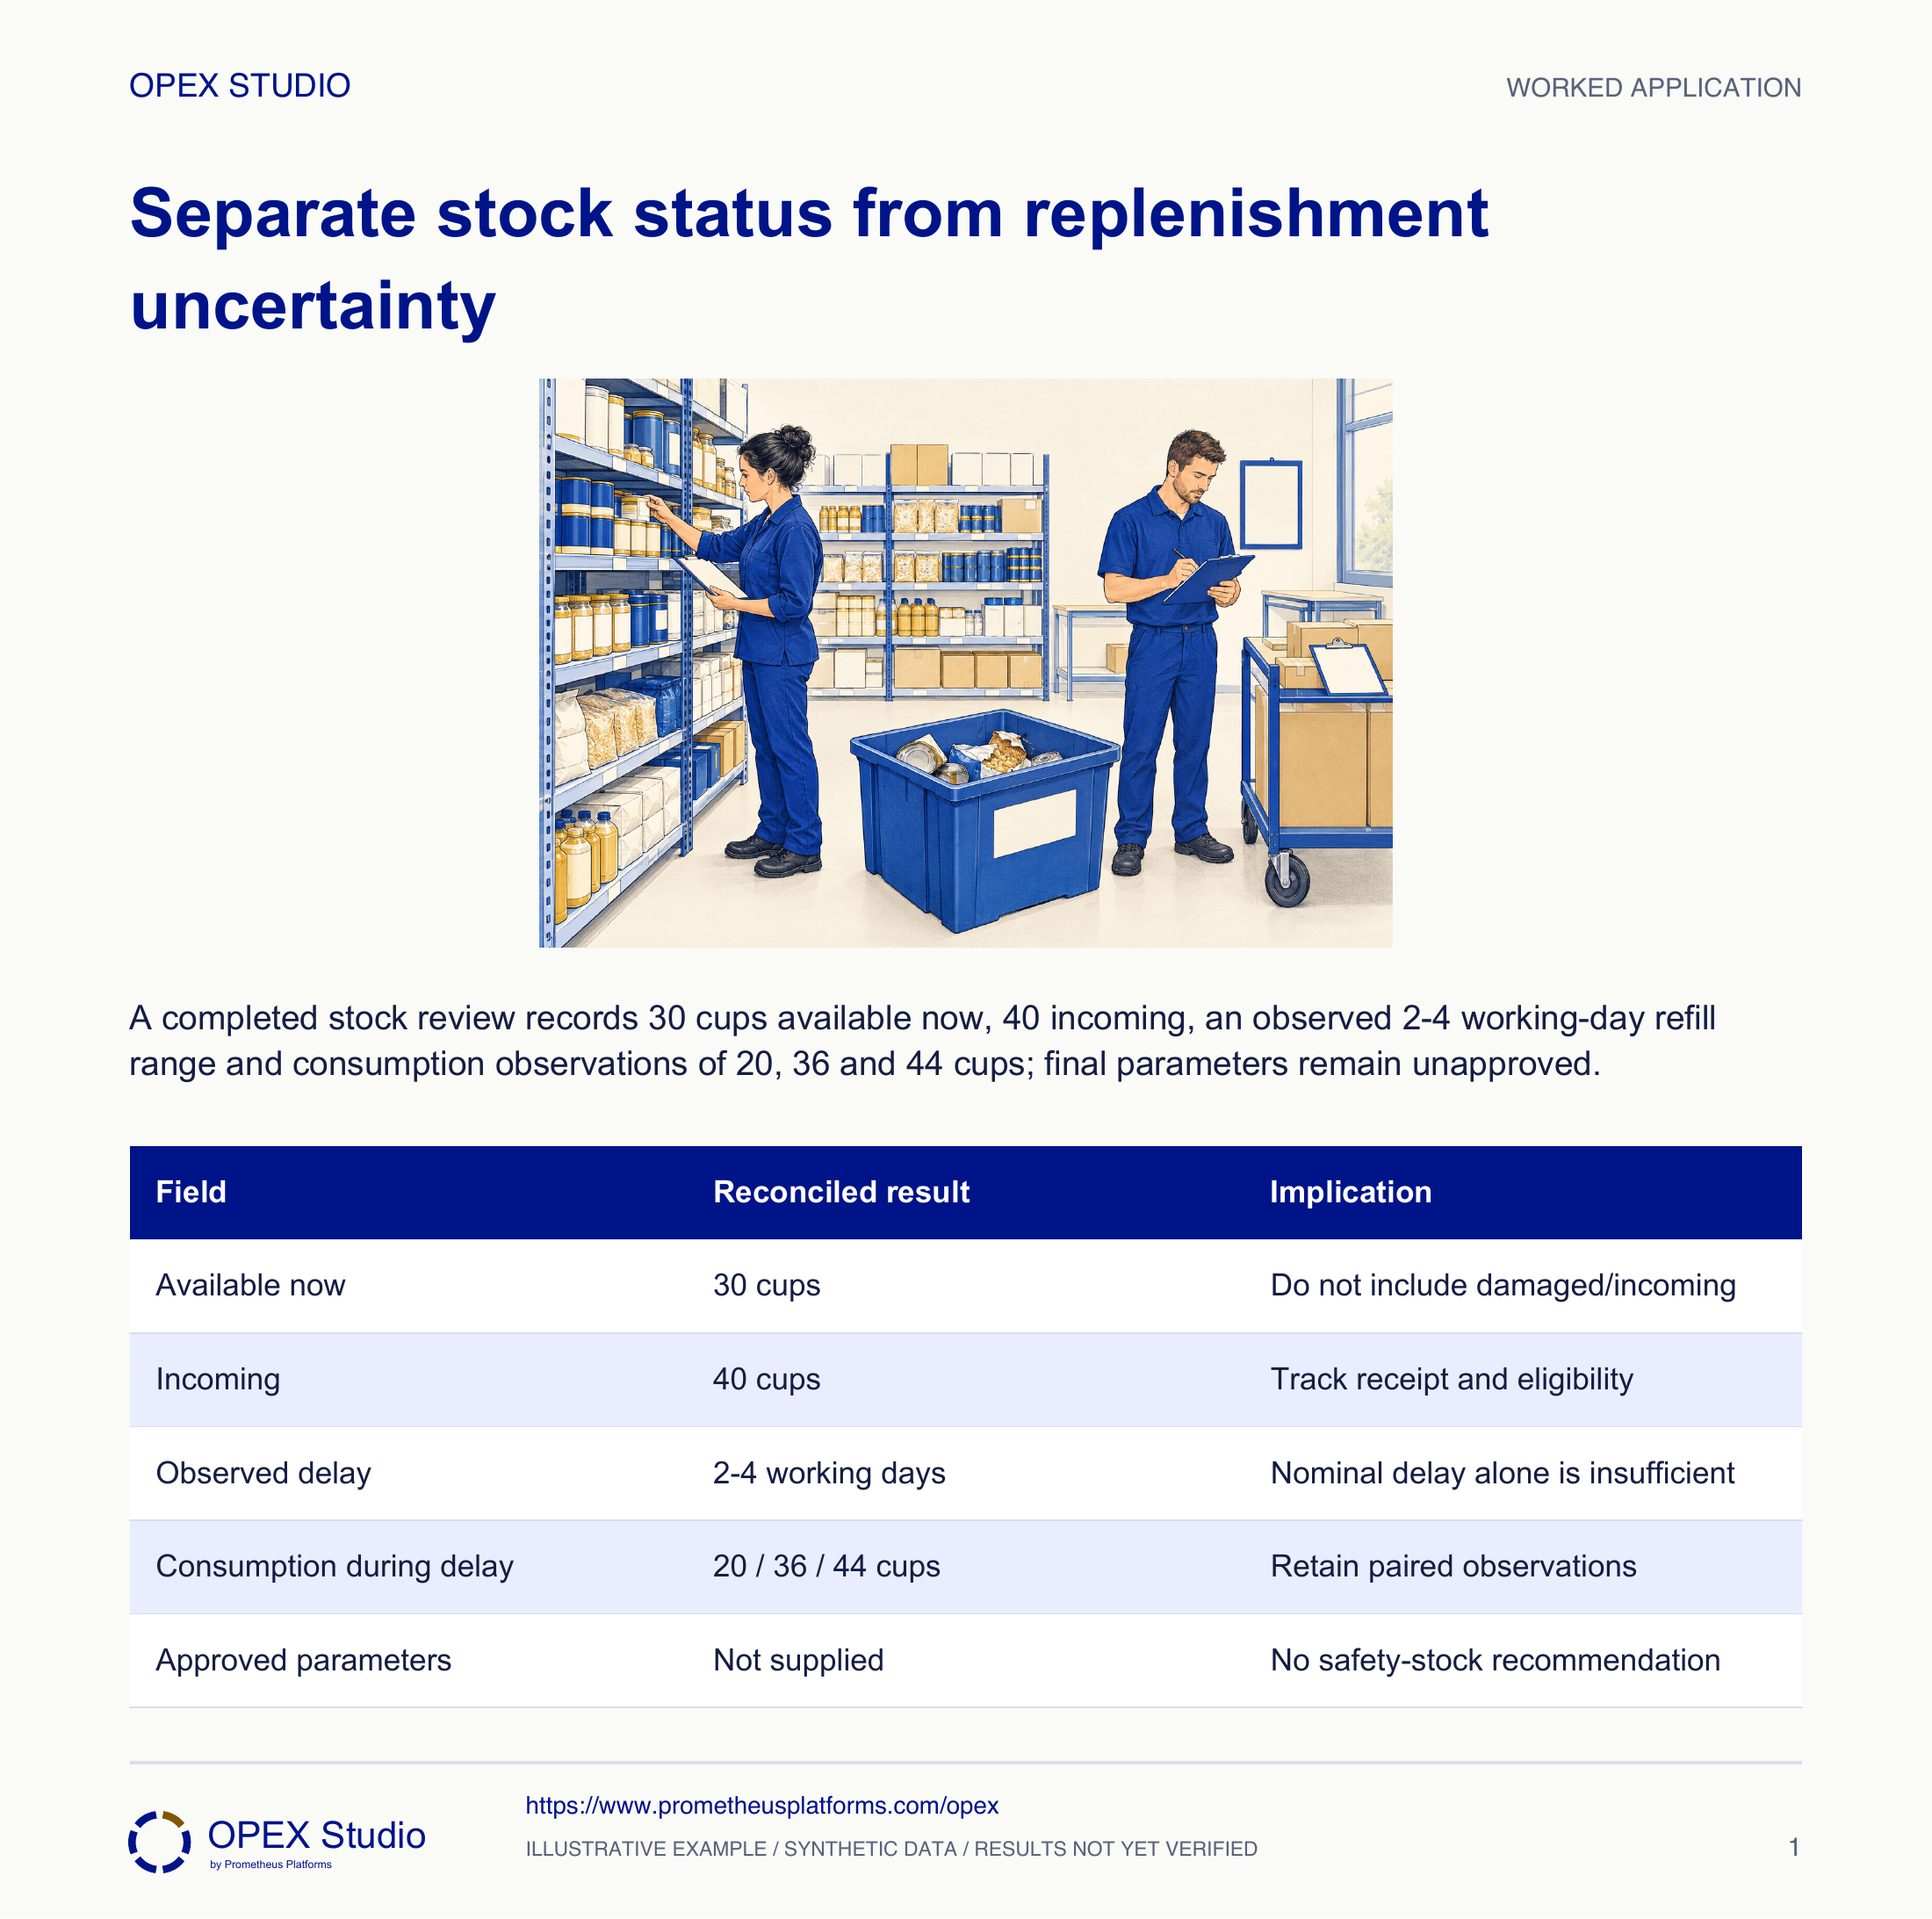
Fictional staff pantry: storekeeper Jo has repeated paper-cup shortages despite a marked shelf. The shelf limit was chosen because four boxes fit. Jo follows three replenishment cycles to distinguish usable stock, orders in transit and actual refill delay. This extends a conceptual stock envelope; it does not supply an approved safety-stock formula.
Update the expected receipt and communicate the service risk using the current usable stock and expected demand; apply the approved shortage response.
Changing a due date does not create stock. Do not quietly mark an order received to make the display look healthy.
Reconcile usable stock and replenishment events, identify lead-time uncertainty, and assemble the evidence needed before approving a stock policy.
Fictional staff pantry: storekeeper Jo has repeated paper-cup shortages despite a marked shelf. The shelf limit was chosen because four boxes fit. Jo follows three replenishment cycles to distinguish usable stock, orders in transit and actual refill delay. This extends a conceptual stock envelope; it does not supply an approved safety-stock formula.
Role: Inventory owner with purchasing and the people consuming the item.
The controlled stock and replenishment rule support the agreed service need without excessive aged stock or unsuitable handling.
Physical capacity has been mistaken for evidence of required inventory.
| Observation | Supplied fictional evidence |
|---|---|
| Usable stock now | 30 cups |
| Confirmed incoming order | 40 cups; not yet received |
| Damaged stock | 10 cups; not usable |
| Cycle 1 | Replenishment delay 2 working days; consumption during delay 20 cups |
| Cycle 2 | Delay 3 working days; consumption 36 cups |
| Cycle 3 | Delay 4 working days; consumption 44 cups |
Jo reconciles the 30 usable cups, 10 damaged cups and 40 on order. She records them separately rather than reporting 80 cups available now.
Why: A total across different statuses obscures the service risk. Incoming stock cannot satisfy today’s need until it arrives and is eligible.
Evidence: Available now: 30; damaged: 10; incoming: 40.
For each cycle, record the actual signal time and time the received cups become usable at the point of use. Include ordering, delivery and put-away delays inside that boundary.
Why: Supplier transit alone can understate the period the stock must cover. The conceptual stock curve needs an operational clock.
Evidence: Observed working-day delays: 2, 3 and 4.
Link each delay to consumption during that same interval: 20, 36 and 44 cups. Keep exceptional causes and demand conditions attached to their cycle.
Why: Combining an average demand with an unrelated nominal lead time can conceal the observed variation. Three points are evidence to investigate, not a distribution model.
Evidence: The longest observed cycle also consumed 44 cups; this is an observation, not a recommended buffer.
Agree the required service, review cycle, order constraints, freshness/space/handling limits and reliable stock records. Obtain representative consumption and delay evidence before selecting parameters.
Why: A stock policy trades availability against inventory and practical constraints. Shelf capacity alone answers only the physical storage question.
Evidence: Parameter decision remains open with named missing inputs and owners.
Once the owner approves a bounded trial, record signal, on-order quantity, receipts, stockouts and aged stock. Investigate missed or duplicate signals before simply adding stock.
Why: A replenishment problem can come from inaccurate records or slow response, not only insufficient quantity.
Evidence: A learning record links any parameter change to service and inventory outcomes.
| Field | Reconciled result | Implication |
|---|---|---|
| Available now | 30 cups | Do not include damaged/incoming |
| Incoming | 40 cups | Track receipt and eligibility |
| Observed delay | 2–4 working days | Nominal delay alone is insufficient |
| Consumption during delay | 20 / 36 / 44 cups | Retain paired observations |
| Approved parameters | Not supplied | No safety-stock recommendation |
Purchasing reports that the 40 cups will arrive later than confirmed; the usable count remains 30.
Update the expected receipt and communicate the service risk using the current usable stock and expected demand; apply the approved shortage response.
Changing a due date does not create stock. Do not quietly mark an order received to make the display look healthy.
Revised receipt expectation, communication owner and actual stock remain traceable.
Separate fictional pantry item: 18 usable sachets, six damaged sachets and 24 confirmed on order. Prior refill delays are one and three working days, with consumption of 10 and 28 sachets during those intervals.
| Input | Value |
|---|---|
| Usable / damaged | 18 / 6 sachets |
| Incoming | 24 sachets |
| Delay/consumption pairs | 1 day / 10; 3 days / 28 |
Available now is 18 sachets, not 48. Six are damaged and 24 are not yet received.
The largest supplied observed interval consumption is 28, but two cycles do not establish a service guarantee or account for review frequency, variability and order constraints.
Verify physical versus recorded stock and signal/receipt timestamps; gather representative paired data and agree the service objective before approving a trial.
| Status / observation | Quantity | Meaning |
|---|---|---|
| Usable | 18 | Available now |
| Damaged | 6 | Exclude from eligibility |
| Incoming | 24 | Not available until received |
| Observed consumption | 10 and 28 | Evidence, not approved stock target |
Which cups could a user take now?
When does an incoming cup actually become available?
Why is the largest observed consumption not the complete answer?
What service decision must the owner make?
Reconcile statuses first, then connect each consumption count to its own delay interval.
Owner: Inventory and replenishment owner
Record: Stock-status reconciliation and signal-to-usable-receipt history
Review: Across representative cycles and at the agreed policy review
Evidence: Service outcome, stock accuracy, delay variation and excess/aged stock
Correct signal or receipt controls, obtain missing evidence and review parameters through the owner.
Predetermined stock locations and consumption-triggered replenishment
Method reference; original OPEX scenario and diagram are synthetic teaching content, not source case results.Read the lessons online or use these PDFs to prepare, practise and review with your team. No sign-in needed.
Case objectives, demonstration plans, debriefs, common mistakes and application checks across all 81 workplace cases and method lessons.
Download Facilitator guide PDF · 166 pages · 65.1 MBPrintable case worksheets, blank observation records and five calculation exercises; answers are separate.
Download Learner workbook PDF · 169 pages · 10.7 MBReasoned sample responses, worked calculations and coaching guidance; fictional examples are clearly labelled.
Download Answer key and coaching notes PDF · 105 pages · 8.5 MBThe native method mechanisms and worked applications for all 68 detailed lessons, in a separate bookmarked portrait reference.
Download Method and application reference PDF · 141 pages · 10.2 MBFive illustrated system chapters: 15 Flare concept maps and 26 original workplace teaching cards, with links to all 81 supporting cases and method lessons.
Download Illustrated systems atlas PDF · 69 pages · 55.8 MBExplore this connected method and its separate application conditions.
Explore the connected method →Explore this connected method and its separate application conditions.
Explore the connected method →Explore this connected method and its separate application conditions.
Explore the connected method →Explore this connected method and its separate application conditions.
Explore the connected method →