Facilitator guide
Case objectives, demonstration plans, debriefs, common mistakes and application checks across all 81 workplace cases and method lessons.
Download Facilitator guide PDF · 166 pages · 65.1 MB OPEXSTUDIO
Fix identical task times. Follow the visual, practise a decision, then check your thinking.
Fictional teaching examples and AI-generated illustrations. Proposed changes and goals are not achieved results. Use the written instructions and check local conditions before applying a method.
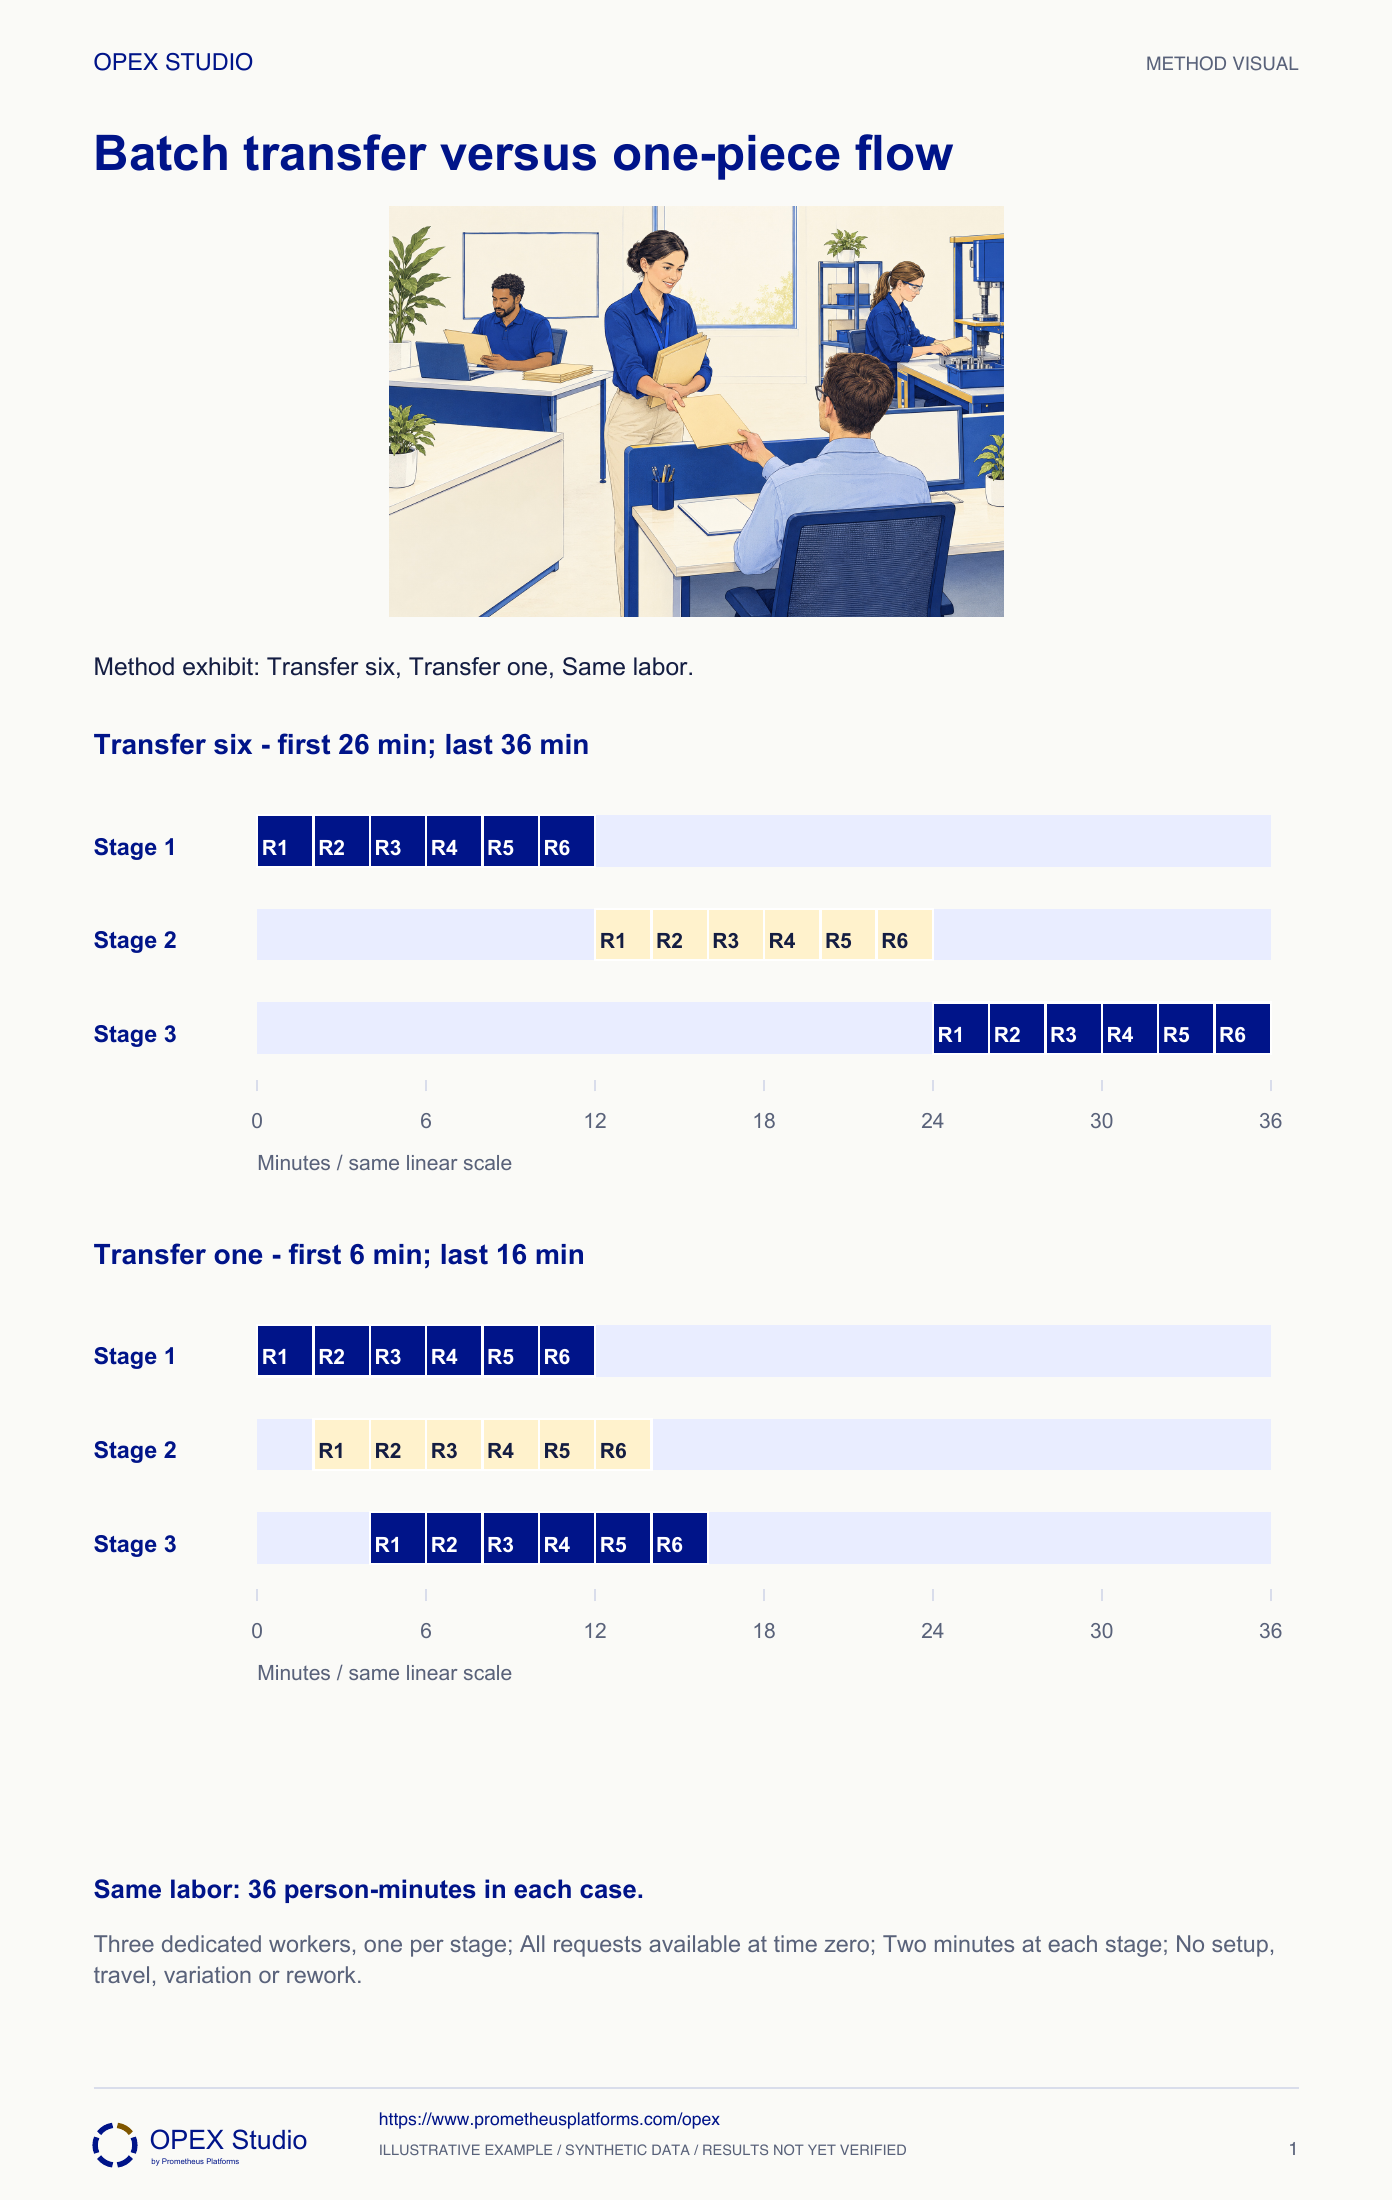
Keep the amount of work identical when comparing transfer policies. Six requests require three two-minute operations, performed by three dedicated workers. With transfer batches of six, the first request completes at minute 26 and the last at 36. With immediate transfer of each request, those times become 6 and 16. Both arrangements contain 36 person-minutes of work. The improvement comes from overlap between stages and less waiting for a batch to fill. Real processes also have travel, setups, variation and quality checks; include those before promising this theoretical result at work.
Synthetic exercise: six requests × three stages × two minutes = 36 person-minutes in both designs.
With one dedicated worker per stage and no setup/travel/rework, transfer batch six finishes first/last at 26/36 min; transfer one at 6/16 min.
Elapsed time and work content are different measures; these are theoretical schedules, not achieved workplace results.
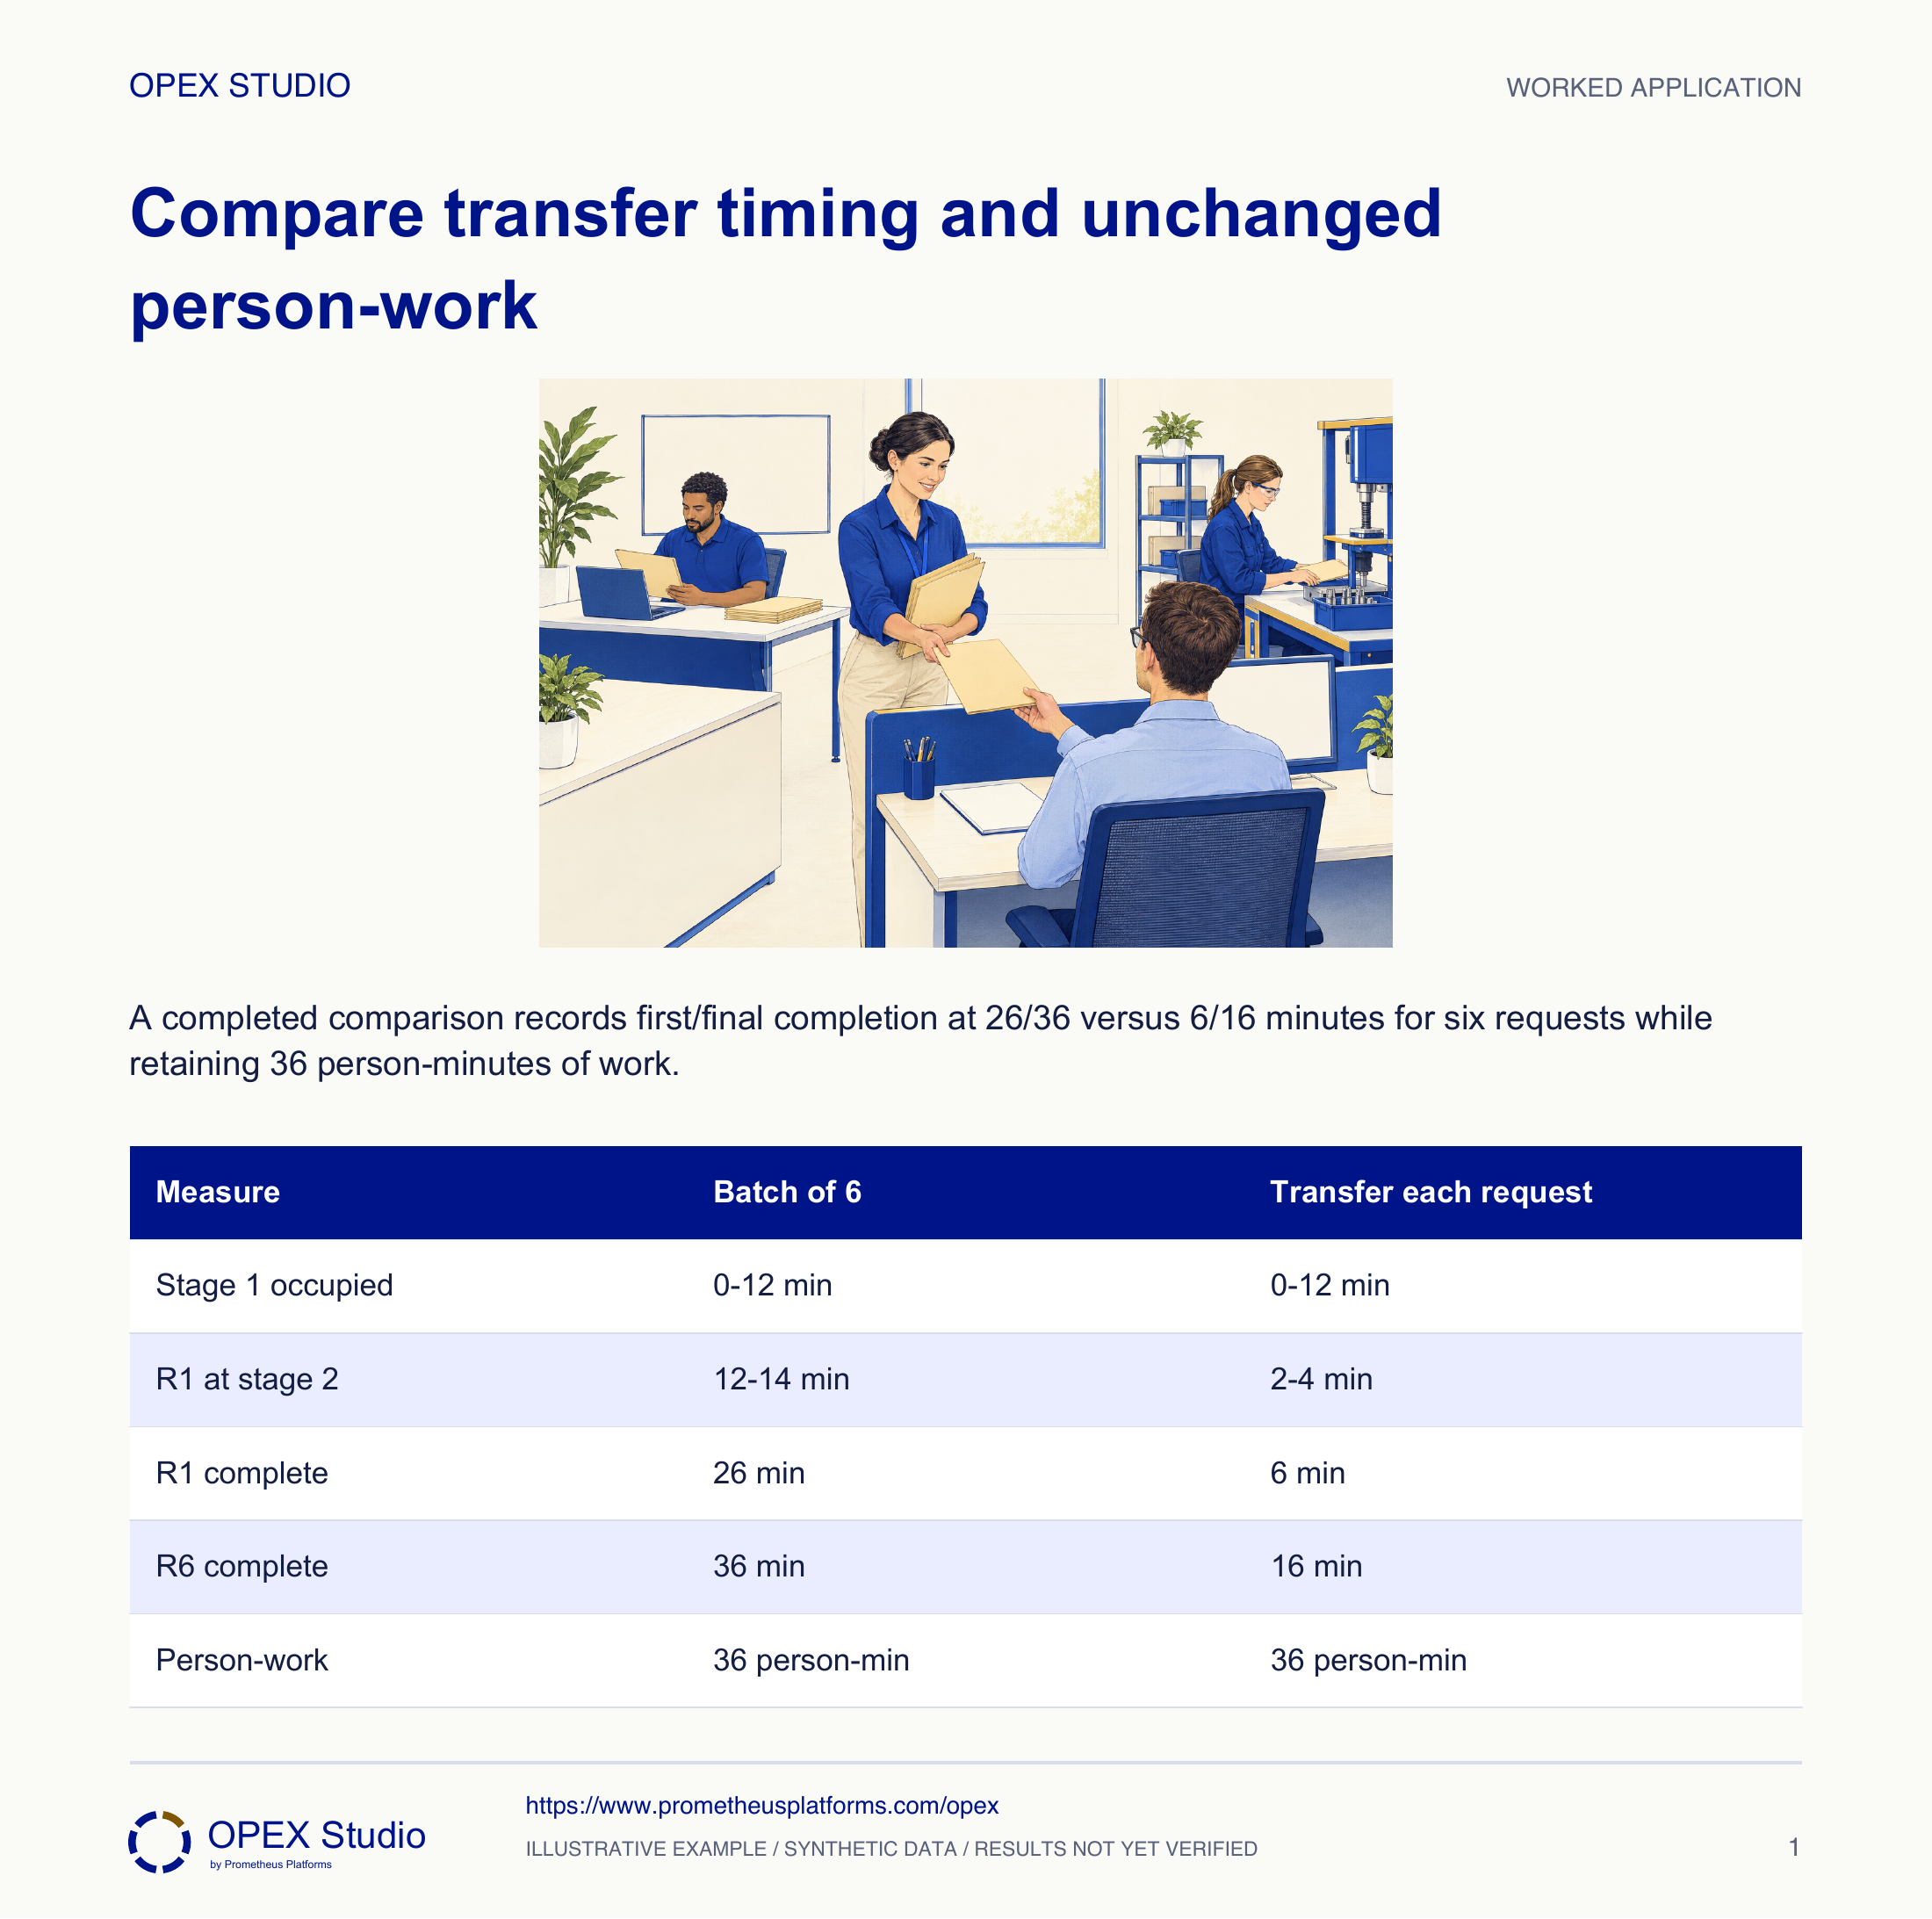
Fictional service simulation: six complete requests R1–R6 are ready at time zero. Three dedicated workers each perform a different two-minute step. Coordinator Anika compares moving the entire six-request batch after each step with transferring each request immediately when its step is done.
Do not assume one-piece processing is feasible. Investigate smaller transfer batches before and after the required batch, subject to the real process constraints.
Processing batch and transfer batch are different decisions; the numerical one-piece result no longer describes this route unchanged.
Construct the two transfer schedules, calculate first and final completion, and explain why lower elapsed lead time does not mean reduced person-work.
Fictional service simulation: six complete requests R1–R6 are ready at time zero. Three dedicated workers each perform a different two-minute step. Coordinator Anika compares moving the entire six-request batch after each step with transferring each request immediately when its step is done.
Role: Service improvement facilitator and the three participating workers.
Every request receives all three steps in order; no worker performs two tasks simultaneously.
The batch rule delays downstream work even when the first request is ready.
| Teaching input | Value |
|---|---|
| Requests ready at time zero | 6 |
| Dedicated stages / workers | 3 / 3 |
| Time per request at each stage | 2 min |
| Batch transfer rule | Move all 6 together |
| One-piece transfer rule | Move each completed request immediately |
| Work required | 6 × 3 × 2 = 36 person-min |
Place R1 at minutes 0–2 through R6 at 10–12 on worker 1’s lane. Use the same first-stage sequence for both alternatives.
Why: Holding the task times and staffing constant isolates the effect of the transfer rule. Otherwise the diagram would mix different causes.
Evidence: Worker 1 finishes the six requests at minute 12 in both schedules.
Worker 2 begins at minute 12 and finishes at 24. Worker 3 begins at 24, completes R1 at 26 and R6 at 36.
Why: R1 waits for its five companions at the first and second handoffs. The waiting is elapsed lead time, not additional processing work.
Evidence: Batch first completion 26 min; final completion 36 min.
With immediate transfer, worker 2 processes R1 at 2–4 while worker 1 processes R2. Worker 3 processes R1 at 4–6; later requests follow every two minutes.
Why: The workers overlap across requests; no request skips precedence and no individual worker is double-booked.
Evidence: One-piece first completion 6 min; R6 leaves stage 3 at minute 16.
Sum all 18 two-minute tasks in each schedule: 36 person-minutes. Compare the first and last completion separately instead of calling 20 saved elapsed minutes a labor saving.
Why: The model reduces waiting through overlap. It does not remove a task or prove fewer people are needed.
Evidence: First completion improves by 20 min and final completion by 20 min; person-work is unchanged.
Check transfer feasibility, information completeness, quality feedback and worker access before trying smaller batches. Record any extra transfer work or interruptions in the actual trial.
Why: The clean simulation omits conditions that may change the result. Small transfers are useful hypotheses, not permission to ignore safety or necessary processing batches.
Evidence: Trial compares completion distribution, rework and actual work content under a declared staffing arrangement.
| Measure | Batch of 6 | Transfer each request |
|---|---|---|
| Stage 1 occupied | 0–12 min | 0–12 min |
| R1 at stage 2 | 12–14 min | 2–4 min |
| R1 complete | 26 min | 6 min |
| R6 complete | 36 min | 16 min |
| Person-work | 36 person-min | 36 person-min |
A required approved process accepts only a validated processing batch. No alternative has yet been qualified.
Do not assume one-piece processing is feasible. Investigate smaller transfer batches before and after the required batch, subject to the real process constraints.
Processing batch and transfer batch are different decisions; the numerical one-piece result no longer describes this route unchanged.
Mark the required batch boundary and recalculate a feasible schedule before claiming a gain.
Separate fictional simulation: four requests, three dedicated workers, each step takes three minutes. All requests are ready at zero and the same no-travel/no-variation assumptions apply.
| Input | Value |
|---|---|
| Requests | 4 |
| Stages | 3 |
| Time per stage | 3 min |
| Staffing | One dedicated worker per stage |
Batch stage intervals are 0–12, 12–24 and 24–36. First completion is minute 27 and last is 36.
Immediate transfer completes the first request at 9 minutes and the fourth at 18 minutes. There are 12 tasks of three minutes: 36 person-minutes in either schedule.
One person cannot perform the overlapping tasks shown on three worker lanes. A different staffing arrangement needs its own feasible schedule.
| Alternative | Completion times, min | Work / decision |
|---|---|---|
| Full batch | First 27; last 36 | 36 person-min |
| Immediate transfer | First 9; last 18 | 36 person-min |
| One-person proposal | Overlapping lanes infeasible | Rebuild schedule |
What must remain identical in the comparison?
Where is R1 waiting although its own task is finished?
Which tasks happen at the same time on different lanes?
Which omitted real-world condition could change the result?
Draw both schedules to scale and audit each worker lane for overlap before reading the answer.
Owner: Process owner with the affected workers
Record: Before/proposed transfer schedule and observed trial record
Review: After a bounded trial covering representative request conditions
Evidence: Order completion timestamps, actual handling work, quality and worker feedback
Retain required processing constraints; revise the feasible transfer arrangement and rerun the comparison.
Flow makes abnormalities visible; support operators when reducing WIP
Method reference; original OPEX scenario and diagram are synthetic teaching content, not source case results.Read the lessons online or use these PDFs to prepare, practise and review with your team. No sign-in needed.
Case objectives, demonstration plans, debriefs, common mistakes and application checks across all 81 workplace cases and method lessons.
Download Facilitator guide PDF · 166 pages · 65.1 MBPrintable case worksheets, blank observation records and five calculation exercises; answers are separate.
Download Learner workbook PDF · 169 pages · 10.7 MBReasoned sample responses, worked calculations and coaching guidance; fictional examples are clearly labelled.
Download Answer key and coaching notes PDF · 105 pages · 8.5 MBThe native method mechanisms and worked applications for all 68 detailed lessons, in a separate bookmarked portrait reference.
Download Method and application reference PDF · 141 pages · 10.2 MBFive illustrated system chapters: 15 Flare concept maps and 26 original workplace teaching cards, with links to all 81 supporting cases and method lessons.
Download Illustrated systems atlas PDF · 69 pages · 55.8 MBExplore this connected method and its separate application conditions.
Explore the connected method →Explore this connected method and its separate application conditions.
Explore the connected method →Explore this connected method and its separate application conditions.
Explore the connected method →Explore this connected method and its separate application conditions.
Explore the connected method →